Table of Contents
What Is Lead Velocity Rate (LVR)?
Why Lead Velocity Rate Is a Strong Predictor of Revenue Growth
Lead Velocity Rate Formula (With Simple Explanation)
How to Calculate Lead Velocity Rate Step by Step
Qualified Lead Velocity Rate vs Total Lead Velocity Rate
Lead Velocity Rate vs Other Sales & Marketing Metrics
What Impacts Lead Velocity Rate in B2B Sales
How Cleverly Helps Teams Increase Lead Velocity Rate Predictably
Conclusion
Frequently Asked Questions
Modified On :
January 19, 2026
Key Takeaways
- Lead velocity rate measures month-over-month growth of qualified leads, not revenue or total lead volume.
- Use the formula: ((This Month's Qualified Leads - Last Month's) / Last Month's) x 100 to calculate LVR.
- Healthy B2B companies maintain 15-25% monthly lead velocity rate for sustainable growth
- Lead velocity rate is a leading indicator that predicts revenue 60-90 days before it happens
- Track qualified lead velocity rate alongside conversion rates and revenue for complete growth visibility
- Consistent multi-channel outbound activity is the biggest driver of stable, positive lead velocity rate
Your sales team closed 50 deals last month. Great news, right? But here's the real question: are you actually growing, or just maintaining pace?
Lead Velocity Rate is the metric that answers this. While most B2B teams obsess over closed deals and revenue, lead velocity rate tells you what's actually coming down your pipeline.
It's the difference between looking at where you've been and seeing where you're headed.
We've worked with over 10,000 B2B companies, and the ones that scale consistently all track one thing: how fast their qualified lead pipeline is growing month over month.
That's lead velocity rate in action.
Let's break down what it is, why it matters, and how to use it to predict your growth before it happens.
What Is Lead Velocity Rate (LVR)?
Lead velocity rate is the month-over-month percentage growth of your qualified leads. Simple as that.
It measures how fast your pipeline of sales-ready prospects is growing, not how much revenue you closed last quarter. Think of lead velocity rate as a speedometer for your sales pipeline. Revenue tells you where you've been. LVR tells you where you're going.
Why that matters: revenue is a lagging indicator. By the time deals close, you're looking at efforts from 30, 60, sometimes 90+ days ago.
Lead velocity rate is a leading indicator. It shows you tomorrow's revenue today.
Lead volume vs lead velocity: What's the Difference?
Most teams confuse these two:
- Lead volume = total number of qualified leads you have right now
- Lead velocity = how fast that number is growing each month
You could have 500 qualified leads in your pipeline and think you're doing great. But if that number was 600 last month, your lead velocity rate is negative. You're shrinking, not growing.
Modern B2B teams track LVR because it's predictive. At Cleverly, we've generated over $312 million in pipeline revenue for our clients, and the companies that scale fastest are the ones watching their qualified lead velocity rate like a hawk.
When you see your qualified lead growth accelerating through channels like LinkedIn outreach or cold calling, you know exactly what your revenue will look like in 60-90 days.
That's the power of tracking lead velocity rate instead of just staring at closed deals.
Check These Tools: Best AI Lead Qualification Tools for Faster B2B Conversions
🚀 LVR Grows When Meetings Grow
From $397/mo LinkedIn outreach to pay-per-meeting email and 10–30 guaranteed calls/month, we fuel the metrics that actually predict revenue.
Why Lead Velocity Rate Is a Strong Predictor of Revenue Growth
Lead velocity rate doesn't just measure growth. It predicts it.
The reality: when you close a deal today, that lead probably entered your pipeline 30 to 90 days ago. Your revenue numbers are showing you the past. Lead velocity rate shows you the future.
Why revenue metrics lag while LVR leads
Think about your sales cycle. A qualified lead comes in today. Your team nurtures them for weeks or months. Then they close. By the time that revenue hits your books, the market conditions that generated that lead are long gone.
Lead velocity rate flips this around. When your qualified lead growth jumps 25% this month, you're looking at a revenue spike in 60-90 days. When it drops, you know you have a problem before it shows up in your bank account.
How investors and SaaS leaders use LVR
Smart investors don't just look at your current revenue. They want to know if you're accelerating or decelerating. Lead velocity rate answers that question instantly.
A B2B company with $100K MRR and 20% monthly lead velocity rate is more valuable than one with $150K MRR and flat lead growth. Why? Because the trajectory is clear. One is building momentum, the other is plateauing.
SaaS leaders track lead velocity rate as their north star metric for exactly this reason. It's the earliest signal that your growth engine is working or breaking down.
When LVR beats MRR and pipeline value
Pipeline value can be misleading. You might have $2M in pipeline, but if those deals have been sitting there for six months, that's not growth. That's stagnation.
Lead velocity rate cuts through the noise:
- Pipeline value tells you what might close, lead velocity rate tells you if you're building momentum.
- MRR shows current revenue, lead velocity rate shows if next quarter will be better or worse.
- Closed deals measure past performance, lead velocity rate measures future potential.
We've seen this play out with thousands of clients at Cleverly. Companies that scale their qualified lead velocity rate through consistent LinkedIn outreach and cold calling systems see predictable revenue growth. The ones that ignore it hit revenue cliffs they never saw coming.
Lead velocity rate is your early warning system and your growth compass rolled into one metric.
Learn More: What “Good Lead Quality” Actually Means in B2B
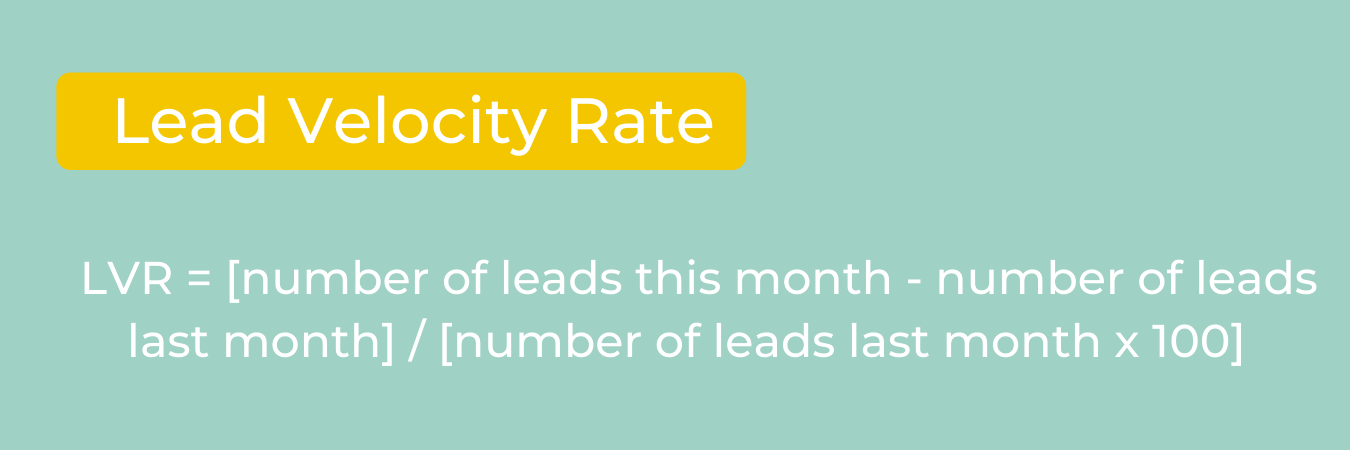
Lead Velocity Rate Formula (With Simple Explanation)
The lead velocity rate formula is straightforward:
LVR = ((Qualified Leads This Month - Qualified Leads Last Month) / Qualified Leads Last Month) x 100
That's it. You're measuring the percentage change in qualified leads from one month to the next.
Breaking down the formula
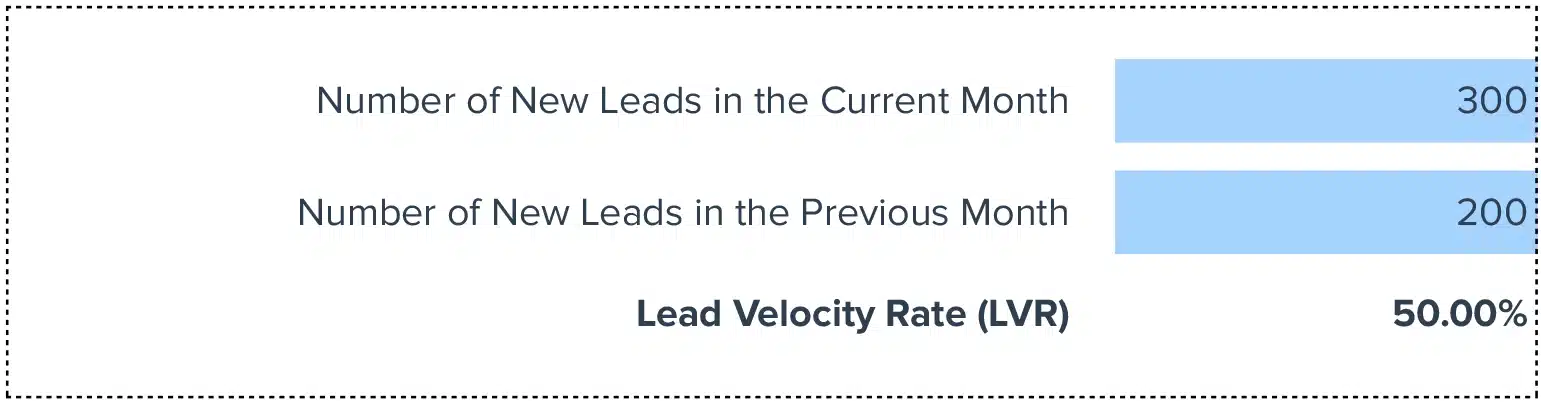
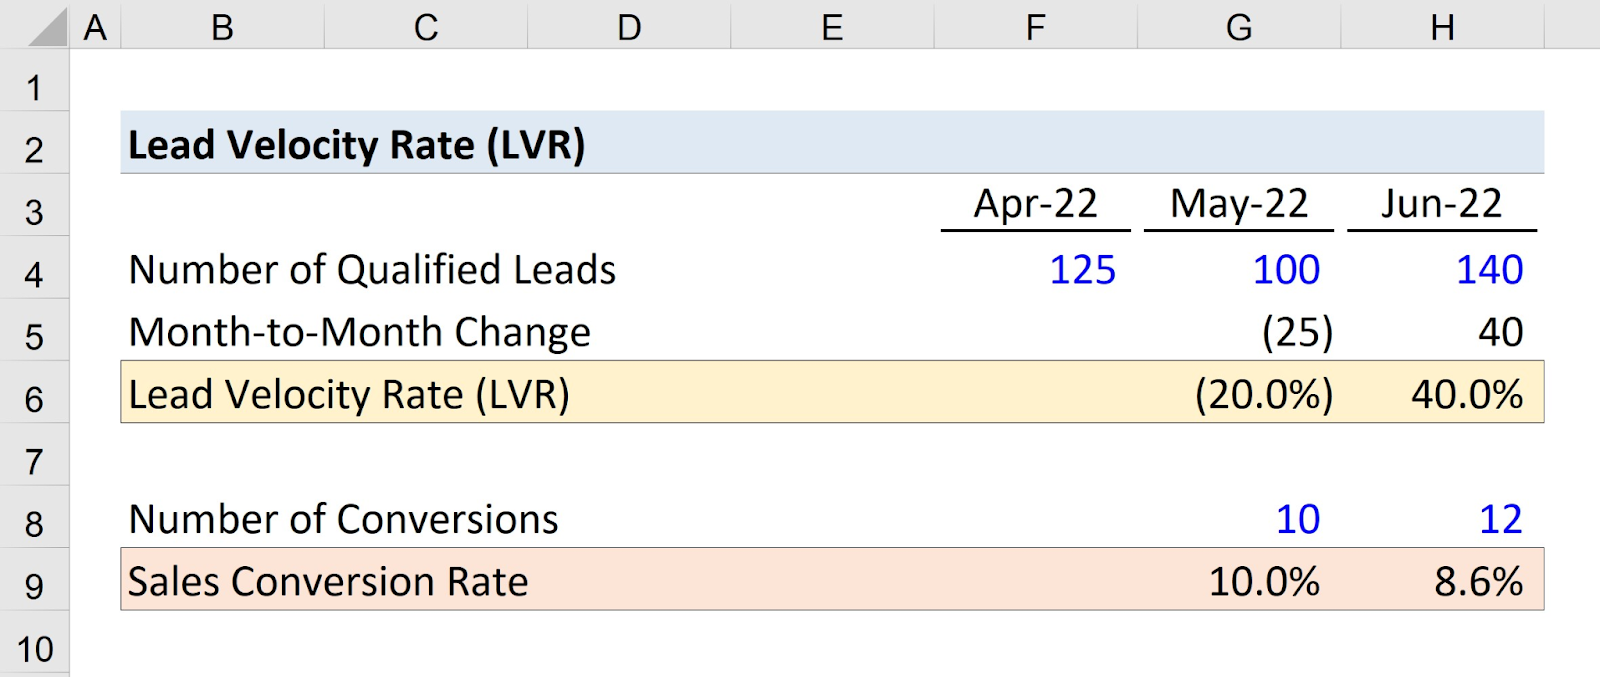
Let's say you had 200 qualified leads in January and 250 in February. Here's how to calculate lead velocity rate:
- Qualified leads this month: 300
- Qualified leads last month: 200
- Difference: 100
- Growth rate: (100 / 200) x 100 = 50%
Your lead velocity rate is 25%. Your qualified pipeline grew by a quarter month-over-month.
What counts as a "qualified lead" for LVR?
This is where most teams mess up the lead velocity rate formula. You can't just count every contact that downloads an ebook or fills out a form.
A qualified lead for lead velocity rate should be:
- Verified contact information
- Meets your ICP (ideal customer profile)
- Shows genuine buying interest or intent
- Ready for sales conversation
At Cleverly, when we talk about our cold calling system booking 10-30 qualified sales calls monthly, we mean leads that hit these criteria. Same with our LinkedIn and cold email services. We only count meeting-ready leads because that's what actually moves through your pipeline.
Common mistakes when calculating LVR
Here's where teams get the lead velocity rate formula wrong:
- Mixing lead stages: Don't combine MQLs, SQLs, and raw contacts. Pick one definition and stick with it.
- Ignoring lead decay: If 50 leads aged out of "qualified" status while 60 new ones came in, your net growth is 10, not 60.
- Cherry-picking timeframes: Calculate lead velocity rate consistently every month. Comparing January to March skips the February dip and gives you false data.
- Counting duplicates: One prospect, one lead. Period.
The lead velocity rate formula only works if you're honest about what "qualified" means and consistent about how you count. Get sloppy here and your growth predictions will be completely off.
Important Read: Lead Quality vs Quantity - Why More Leads Can Hurt B2B Revenue
🔥 Increase LVR With Real Conversations
Cleverly drives consistent pipeline growth using LinkedIn, cold email, and cold calling- feeding sales teams with meeting-ready leads.
How to Calculate Lead Velocity Rate Step by Step
Let's walk through exactly how to calculate lead velocity rate with a real example.
Step-by-step LVR calculation
Say you're a B2B software company tracking qualified leads:
Step 1: Count your qualified leads at the end of last month
- March 31: 180 qualified leads in pipeline
Step 2: Count your qualified leads at the end of this month
- April 30: 225 qualified leads in pipeline
Step 3: Find the difference
- 225 - 180 = 45 new qualified leads
Step 4: Divide by last month's total
- 45 / 180 = 0.25
Step 5: Multiply by 100 for percentage
- 0.25 x 100 = 25%
Your lead velocity rate is 25%. That's strong month-over-month growth.
Monthly vs weekly LVR tracking
Most B2B teams track lead velocity rate monthly because sales cycles typically run 30-90 days. Monthly tracking smooths out weekly fluctuations and gives you cleaner trend data.
Weekly tracking works if you're running high-volume outbound campaigns through channels like LinkedIn or cold calling where you're generating dozens of qualified leads every week. We see this with clients using our cold calling system that books 10-30 qualified calls monthly. Weekly LVR helps them spot issues faster.
The rule: track weekly if you generate 20+ qualified leads per week. Otherwise, stick to monthly.
What a "good" vs "bad" LVR looks like
Here's what we've seen across thousands of B2B companies:
- 15-25% monthly LVR: Healthy, sustainable growth
- 25-40% monthly LVR: Aggressive growth, usually from new channel or campaign
- 5-15% monthly LVR: Slow growth, needs optimization
- 0-5% monthly LVR: Stagnation warning sign
- Negative LVR: Red alert, pipeline is shrinking
Context matters though. A qualified lead velocity rate of 10% means different things depending on your stage.
Early-stage vs Mature teams: Different LVR Expectations
Early-stage companies (less than $1M ARR):
- Should target 20-40% monthly lead velocity rate
- Easier to achieve high percentages from smaller base numbers
- Focus on finding repeatable channels that consistently hit 15%+
Growth-stage companies ($1M-$10M ARR):
- Should target 15-25% monthly lead velocity rate
- Harder to maintain high percentages as volume increases
- Need multiple channels working together
Mature companies ($10M+ ARR):
- Should target 10-20% monthly lead velocity rate
- Maintaining double-digit growth at scale is impressive
- Small percentage changes represent massive lead volume
If you're early stage and only hitting 5% lead velocity rate, you haven't found product-market fit yet. If you're at $50M ARR maintaining 15% LVR, you're absolutely crushing it.
The key is knowing how to calculate lead velocity rate consistently and comparing it against realistic benchmarks for your stage.
We've helped generate $312 million in pipeline across 10,000+ clients, and the pattern is clear: companies that maintain 15%+ qualified lead velocity rate through systematic outbound programs scale predictably.
Here’s More: How to Master Lead Enrichment for Smarter B2B Sales?
Qualified Lead Velocity Rate vs Total Lead Velocity Rate
Not all leads are created equal. Here's why tracking qualified lead velocity rate matters more than total lead volume:
Why qualified lead velocity rate is more reliable
You could generate 1,000 new leads this month and celebrate a 200% total lead velocity rate. But if only 50 of those leads are actually qualified, your qualified lead velocity rate tells the real story.
Qualified lead velocity rate filters out the noise:
- Total LVR counts everyone who downloaded your ebook or visited your pricing page.
- Qualified LVR only counts leads your sales team can actually call and close.
At Cleverly, when we talk about generating $51.2 million in closed revenue for clients, we're measuring qualified lead velocity rate. Our LinkedIn outreach, cold email, and cold calling services focus on meeting-ready leads, not raw contact volume. That's the difference between vanity metrics and revenue predictors.
Track total lead velocity to spot trends. Track qualified lead velocity rate to forecast revenue.
Related: B2B Lead Scoring Explained
Lead Velocity Rate vs Other Sales & Marketing Metrics
Lead velocity rate doesn't exist in a vacuum. Here's how it stacks up against the metrics you're already tracking.
LVR vs Pipeline Growth

Pipeline growth measures the total dollar value of opportunities in your sales funnel. Lead velocity rate measures how fast qualified leads are entering that funnel.
The difference matters:
- Your pipeline could grow because deal sizes increased, not because you have more opportunities.
- Lead velocity rate isolates lead volume growth, showing you if you're actually generating more chances to close business.
- Pipeline value can stagnate while lead velocity rate surges (leads haven't converted to opps yet) or vice versa (closing old deals while new lead flow dries up).
Track both. Pipeline shows short-term revenue potential. Lead velocity rate shows if that pipeline will refill next month.
LVR vs Conversion Rate
Conversion rate tells you what percentage of leads become customers. Lead velocity rate tells you if you're generating more leads to convert.
Here's the dynamic:
- 10% conversion rate on 100 leads = 10 customers
- 10% conversion rate on 200 leads = 20 customers
- Same conversion rate, double the customers because lead velocity rate increased
You can have a perfect conversion rate and still fail to grow if your lead velocity rate is flat or negative.
LVR vs Revenue Growth

Revenue growth is the ultimate scorecard. Lead velocity rate is the leading indicator that tells you if that scorecard will look better or worse in 60-90 days.
The relationship:
- Lead velocity rate up, conversion rate stable = revenue growth coming
- Lead velocity rate flat, conversion rate improving = short-term gains, long-term plateau
- Lead velocity rate negative, revenue still growing = you're about to hit a cliff
Revenue is backward-looking. Lead velocity rate is forward-looking. When clients come to us at Cleverly after seeing revenue flatten, the first thing we check is their qualified lead velocity rate from 2-3 months prior. Usually it dropped before revenue did, they just weren't watching it.
Why LVR should complement, not replace, other metrics
Don't pick one metric and ignore the rest. Lead velocity rate is most powerful when you read it alongside:
- Conversion rates: Shows if lead quality is holding steady as volume grows
- Sales cycle length: Reveals if new leads are taking longer to close
- Customer acquisition cost: Tells you if lead velocity rate growth is profitable or expensive
- Revenue: Validates that your lead growth is actually translating to dollars
If your lead velocity rate drops 20% this month, you don't wait until revenue tanks next quarter. You fix your lead generation now.
Our cold calling system that guarantees 10-30 qualified calls monthly and our LinkedIn services starting at $397/month are built around this principle. Consistent lead velocity rate creates predictable revenue.
That's how we've helped generate $312 million in pipeline for over 10,000 clients. The companies that win are the ones watching all the metrics but acting fastest on lead velocity rate signals.
Explore Further: How to Measure Sales Success
What Impacts Lead Velocity Rate in B2B Sales
Your lead velocity rate doesn't move in a straight line. Here's what makes it spike or crash.
Outbound activity consistency
This is the biggest lever. Your lead velocity rate directly reflects how many prospects you're reaching consistently.
- Run LinkedIn outreach for two weeks then stop? Your lead velocity rate craters next month.
- Launch a cold calling campaign that books 10-30 qualified calls monthly like clockwork? Your lead velocity rate stays positive.
- Send cold emails sporadically? You'll see spiky, unpredictable lead velocity rate swings.
The pattern we've seen across 10,000+ clients: companies with systematic daily outbound activity maintain steady 15-25% lead velocity rate. Companies that campaign in bursts see their LVR yo-yo between 40% and negative 10%.
Market conditions and seasonality
B2B buying doesn't happen evenly across the year:
- December and August typically see lead velocity rate dips (holidays, vacations).
- Q1 and Q4 often show spikes (new budgets, year-end spending).
- Economic uncertainty slows decision-making and drags down qualified lead velocity rate.
You can't control the market, but you can adjust expectations. A 5% lead velocity rate in August might actually be strong performance.
ICP targeting accuracy
Spray and pray kills lead velocity rate. Here's why:
If you're reaching the wrong people, you generate lots of contacts but few qualified leads. Your total lead count might grow, but your qualified lead velocity rate stays flat because none of them are actually sales-ready.
Tighten your ICP and your lead velocity rate might initially drop (fewer total leads) but your qualified rate jumps (higher quality leads). That's the trade you want.
Lead response speed
This one surprises people. Your team's response time directly impacts lead velocity rate the following month.
When you respond to inbound leads within 5 minutes, conversion rates jump. Those positive interactions create referrals and word-of-mouth. Next month, your lead velocity rate gets a boost from the compound effect.
Slow response times do the opposite. Leads go cold, deals stall, and your lead velocity rate reflects the decay.
Channel mix and performance
Different channels produce different lead velocity rate patterns:
- LinkedIn outreach: Steady, predictable flow when done consistently
- Cold calling: Fast ramp-up, immediate impact on lead velocity rate
- Cold email: Volume play, needs scale to move qualified lead velocity rate
- Inbound/content: Slow build, long-term lead velocity rate growth
- Paid ads: Can spike lead velocity rate quickly but expensive to maintain
The companies with the healthiest lead velocity rate run multiple channels simultaneously. When one dips, another compensates. We've generated $312 million in pipeline by helping clients layer LinkedIn, cold email, and cold calling together. That diversification stabilizes lead velocity rate month over month.
Another Compare: LinkedIn vs Cold Email vs Cold Calling
Sales and marketing alignment
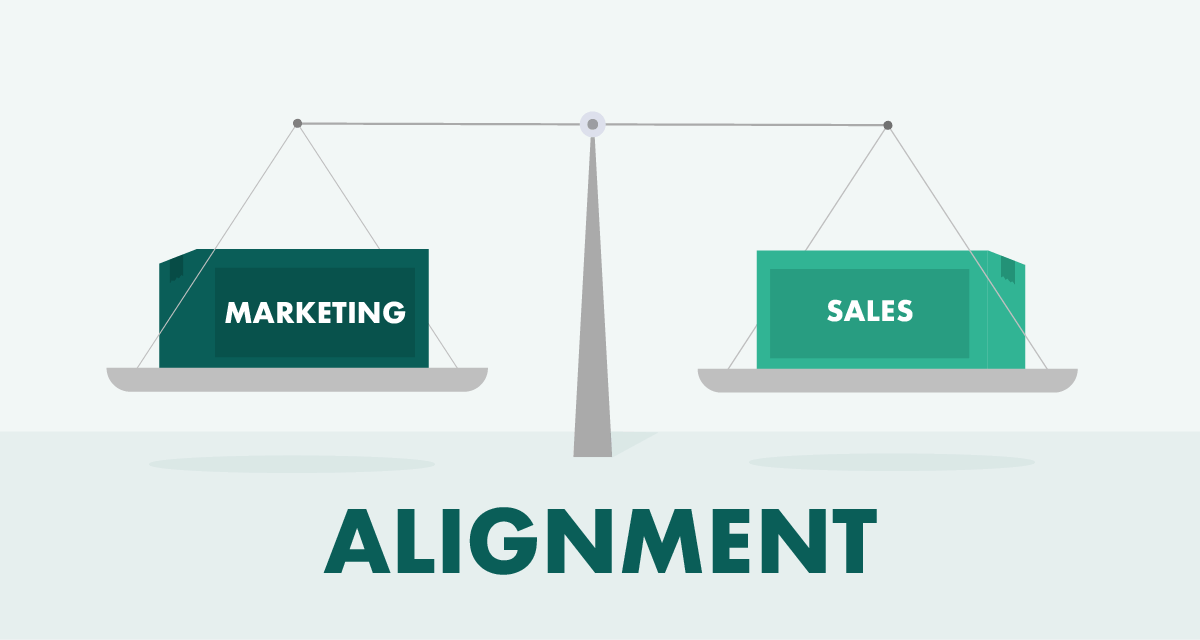
Misalignment tanks lead velocity rate faster than anything:
- Marketing generates leads, sales says they're unqualified? Your qualified lead velocity rate shows the disconnect.
- Sales doesn't follow up on marketing leads? Next month's lead velocity rate drops because nurturing stopped.
- No agreed definition of "qualified"? Your lead velocity rate calculation becomes meaningless.
Fix the sales and marketing alignment and watch lead velocity rate stabilize.
The bottom line: lead velocity rate is a mirror. It reflects your entire go-to-market execution. Consistent outbound activity, tight ICP targeting, fast follow-up, and multi-channel approach all push it up. Inconsistency, poor targeting, and misalignment drag it down.
How Cleverly Helps Teams Increase Lead Velocity Rate Predictably
Looking for a lead generation agency that actually moves your lead velocity rate? Here's how we do it differently:
🚀 We focus on qualified meetings, not raw lead counts
- You only pay for meeting-ready leads with our cold email service
- Our cold calling system guarantees 10-30 qualified sales calls monthly
- LinkedIn outreach starting at $397/month targets decision-makers, not contacts
🚀 We build consistent outbound systems that raise LVR month-over-month
- No campaign bursts that spike then crash your lead velocity rate
- Daily systematic outreach that compounds over time
- Predictable lead flow you can forecast revenue around
🚀 Multi-channel approach stabilizes and accelerates lead velocity
- LinkedIn + cold email + cold calling working simultaneously
- When one channel dips, others compensate
- Diversified pipeline keeps your qualified lead velocity rate climbing
🚀 Consistent execution improves your forecasting confidence
- Know exactly how many qualified leads are coming next month
- Plan hiring, budget, and growth with real data
- No more guessing if your pipeline will refill
🚀 We're your growth partner, not just a lead vendor
- 10,000+ clients trust us to build their pipeline engine
- $312 million in pipeline generated, $51.2 million closed
- We succeed when your lead velocity rate drives revenue growth
Want a predictable increase in qualified leads every month? Cleverly helps teams build real lead velocity.
🔥 Book a FREE Consultation & let's grow your qualified pipeline systematically.

Conclusion
Lead velocity rate isn't another vanity metric to stick on a dashboard. It's your growth engine's speedometer.
While most B2B teams are staring at last quarter's revenue, lead velocity rate shows you what's coming in the next 60-90 days. That's the difference between reacting to problems and preventing them.
The teams that track lead velocity rate early make smarter decisions. They know when to hire another SDR, when to scale ad spend, and when to pump the brakes before burning cash on a broken funnel. They're not guessing. They're reading the signals.
Start measuring your qualified lead velocity rate today. Calculate it monthly. Watch the trends. And when you're ready to build a system that consistently moves that number up, you know where to find us.
Because lead velocity rate doesn't just predict growth. It creates it.
Frequently Asked Questions
Free Resource
How to Scale a Profitable Cold Call System
Get the complete guide — download it instantly now.

Free Ebook
Download the Free Guide
Enter your details to get instant access.
You're all set! 🎉
Your ebook is downloading now.
Click below if the download didn't start automatically.