Table of Contents
What Does "Sales Success" Really Mean in B2B?
Core Sales Performance Indicators You Must Track
Sales Rep Performance Metrics
Sales Productivity Metrics That Reveal Efficiency
Sales Metrics Examples by Funnel Stage
How Often Should You Measure Sales Performance?
How to Build a Sales Success Dashboard That Drives Action
How Cleverly Helps Teams Measure Sales Success Beyond Vanity Metrics
Conclusion
Frequently Asked Questions
Modified On :
January 10, 2026
Key Takeaways
- Sales success is measured by outcomes (revenue, pipeline, conversions), not activity (calls made, emails sent).
- Track metrics across all funnel stages: top (reply rates), mid (show rates), and bottom (close rates) to diagnose exactly where problems occur.
- Balance leading indicators (pipeline coverage, new opportunities) with lagging indicators (closed revenue, quota attainment) for complete visibility.
- Measure different metrics at different intervals: daily for activity, weekly for pipeline, monthly for outcomes, quarterly for strategy.
- Sales rep performance must account for output efficiency, not just effort: win rates, deal size, and activity-to-outcome ratios matter most.
- A useful dashboard has 8-12 core metrics maximum that directly answer "what do we fix next?" rather than overwhelming you with data
You're tracking your sales numbers religiously. Calls made, emails sent, meetings booked. But here's the real question: are you measuring what actually moves the needle, or just what's easy to count?
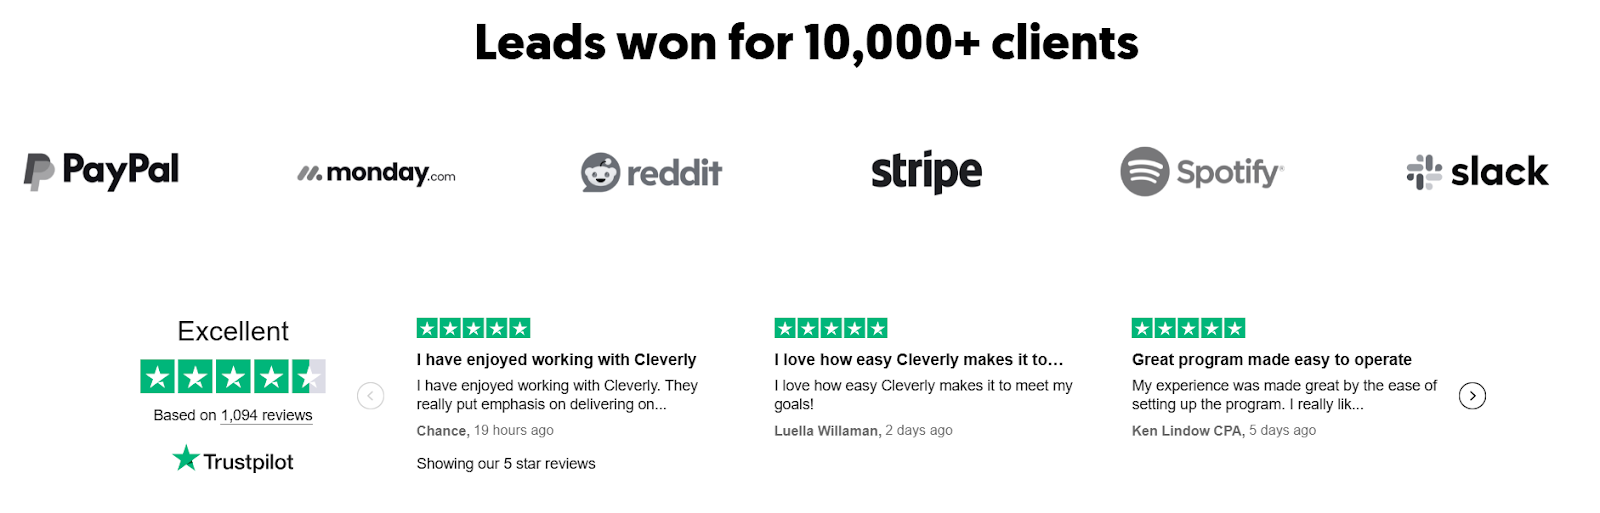
We've worked with over 10,000 sales teams, and here's what we've learned: most companies drown in data while starving for insights.
They celebrate activity metrics while revenue stays flat. Sound familiar?
How to measure sales success isn't about tracking everything. It's about tracking the right things. The metrics that predict revenue, identify top performers, and show you exactly where your sales process breaks down.
In this guide, we're cutting through the noise. Let’s uncover the sales performance indicators that actually matter, how to track them, and what to do when the numbers tell you something's broken.
Get into what separates sales teams that hit quota from those that wonder why they're always behind.
What Does "Sales Success" Really Mean in B2B?
Before you can track the right numbers, you need to understand what success actually looks like. And here's where most B2B teams get it wrong.
Sales Success vs Sales Activity
Your rep made 100 cold calls today. Great. But did any of them turn into revenue?
Activity doesn't equal success. It's the foundation, sure, but confusing the two is like celebrating that you went to the gym without asking if you're actually getting stronger.
How to measure sales performance starts with separating what your team does from what your team achieves.
Activity metrics tell you if someone's working. Outcome metrics tell you if that work matters. You need both, but never mistake one for the other.
Short-Term Wins vs Long-Term Pipeline Health
Closing a deal this month feels good. But if your pipeline is empty for next quarter, you're not successful. You're just delaying a problem.
Real sales success balances immediate revenue with future opportunity:
- Short-term: Closed deals, revenue generated, quota attainment this month/quarter
- Long-term: Pipeline coverage, deal velocity, customer lifetime value, retention rates
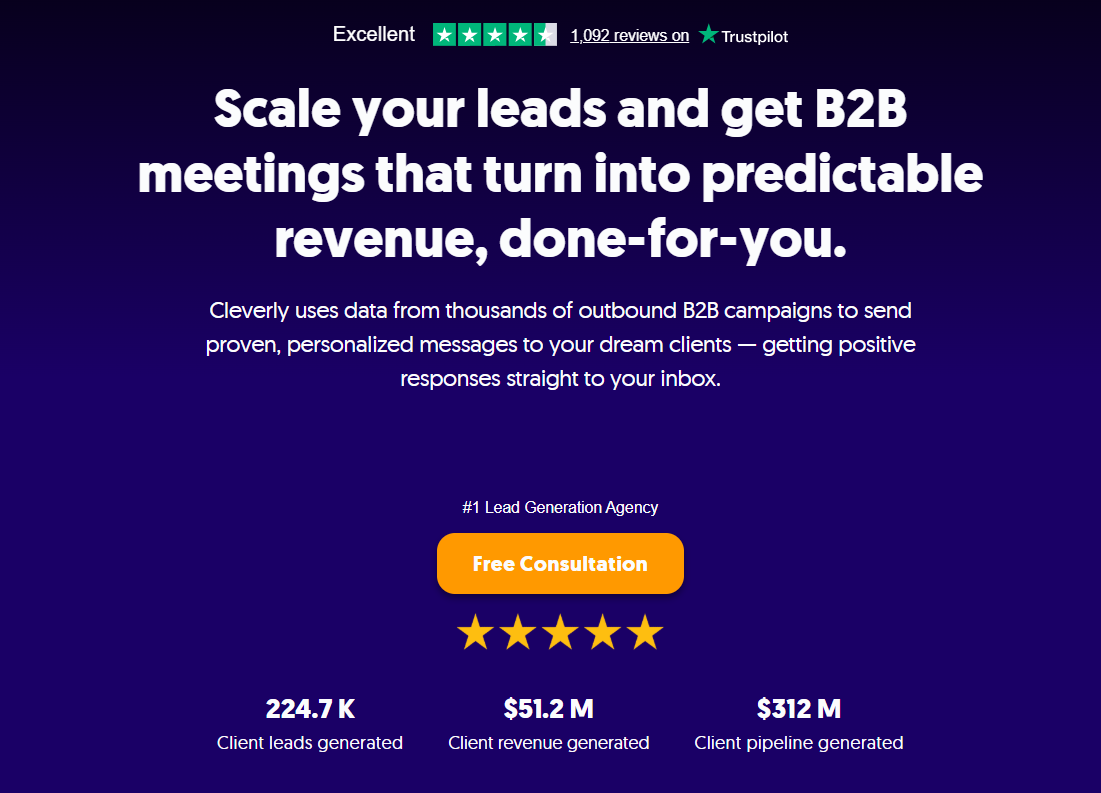
At Cleverly, we've generated over $312 million in pipeline revenue for our clients because we focus on both. Booking meetings today while building sustainable lead flow for tomorrow.
Why Success Must Be Measured Across the Full Funnel
Your sales process isn't a single moment. It's a journey from cold prospect to closed customer. And sales performance indicators need to reflect that reality.
Measuring only at the top (leads generated) or bottom (deals closed) leaves blind spots:
- Top of funnel only: You're generating leads but have no idea why they're not converting.
- Bottom of funnel only: You can't see problems until it's too late to fix them.
Track conversion rates at every stage. Where prospects enter, where they engage, where they stall, and where they buy. The full picture shows you exactly where to improve.
Check These Tools: Best Prospecting Tools for B2B Sales Teams (Free & Paid)
🔥 Track What Closes Deals
Cleverly delivers meeting-ready leads across LinkedIn, email, and calls—so your top metric is revenue booked, not activity logged.
Core Sales Performance Indicators You Must Track
Let's get specific. These are the sales performance indicators that actually predict whether you'll hit your numbers or miss them.
Revenue-Based Indicators: The Bottom Line Metrics
This is what pays the bills. Track these religiously:
- Closed-won revenue: Total dollars from closed deals in a given period.
- Average deal size: Total revenue divided by number of deals (shows if you're moving upmarket or down).
- Revenue growth rate: Month-over-month or year-over-year percentage increase.
These numbers don't lie. If revenue isn't growing, nothing else matters. But here's the catch: by the time revenue drops, the damage is already done. That's why you need the next three categories.
Pipeline Indicators: Your Early Warning System
Your pipeline tells you what's coming before it hits your bank account:
- Total pipeline value: Sum of all open opportunities weighted by stage.
- Pipeline coverage ratio: Pipeline value divided by quota (healthy is typically 3-4x).
- New pipeline created: Fresh opportunities added this month/quarter.
If your pipeline coverage drops below 3x quota, you're in trouble next quarter even if this quarter looks fine.
We see this constantly with clients before they start working with us. Their LinkedIn outreach and cold email campaigns aren't creating enough new pipeline to sustain growth.
Conversion Indicators: Where Deals Die (or Live)
Sales performance indicators at each funnel stage show you exactly where your process breaks:
- Lead to meeting rate: Percentage of leads that become first meetings
- Meeting to opportunity rate: Percentage of meetings that enter your pipeline
- Opportunity to closed-won rate: Your closing percentage
Let's say your lead-to-meeting rate is 2%, but your meeting-to-opportunity rate is 60%. That tells you lead quality is your problem, not your sales team's closing skills. Fix the right thing.
Velocity Indicators: How Fast Money Moves
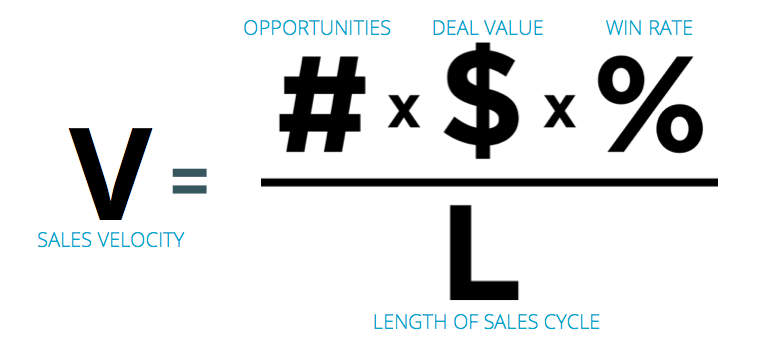
Speed matters. The faster deals close, the more revenue you generate with the same resources:
- Average sales cycle length: Days from first contact to closed deal
- Time to first meeting: Days from lead creation to booked appointment
- Stage duration: How long deals sit in each pipeline stage
A 90-day sales cycle that becomes 60 days means you close 50% more deals with the same pipeline. Our cold calling system books qualified appointments in weeks, not months, specifically because velocity compounds over time.
Track all four categories. Revenue tells you where you are. Pipeline tells you where you're going. Conversion tells you what's broken. Velocity tells you how efficient you are.
Learn More: Sales Call Reports - Templates, Examples & How to Create Them
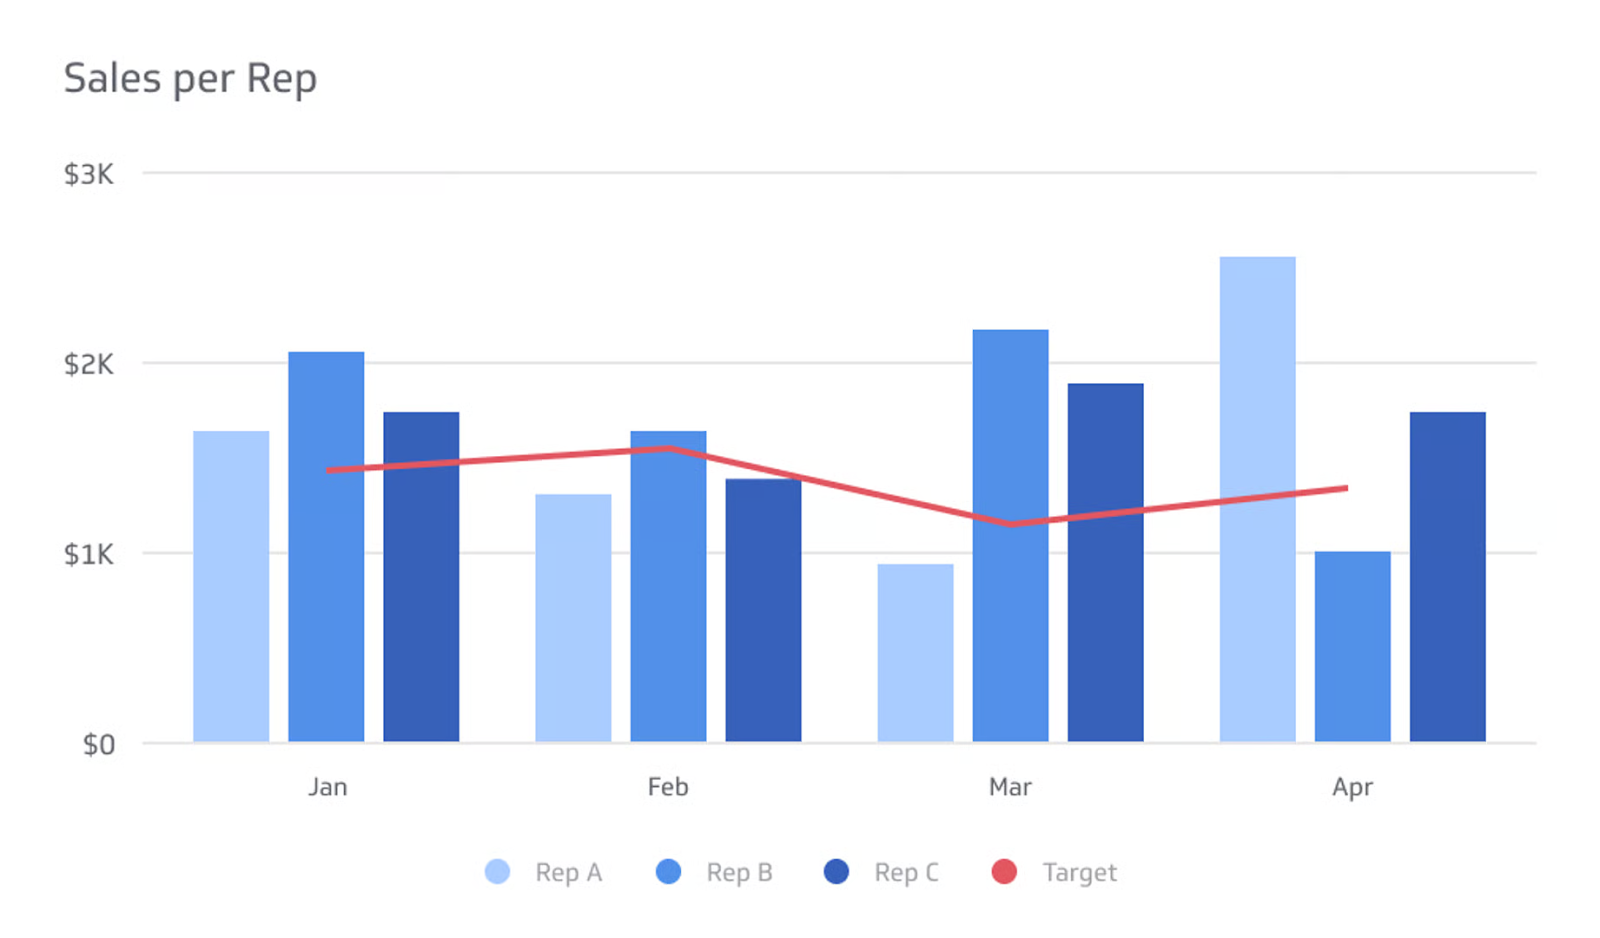
Sales Rep Performance Metrics
Team numbers matter, but individual sales rep performance metrics tell you who's crushing it, who needs coaching, and who might be in the wrong role.
Meetings Booked vs Meetings Held
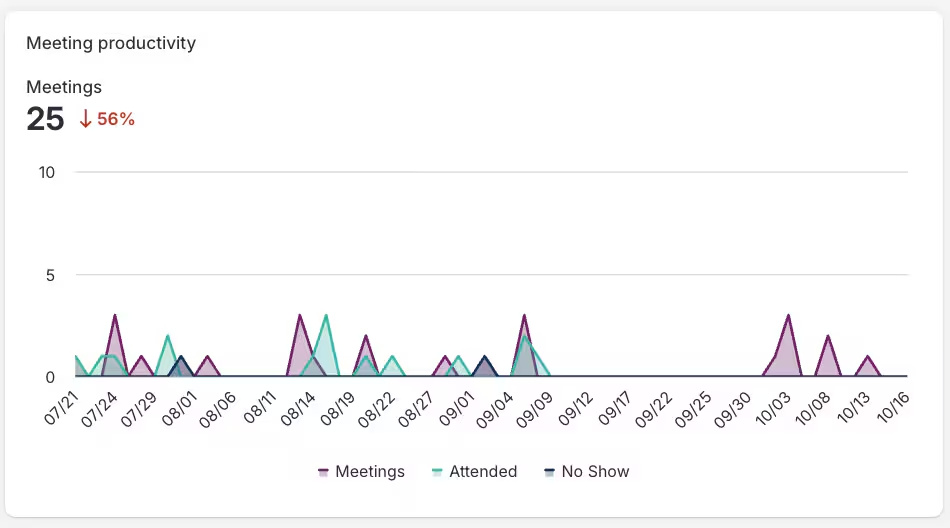
Here's a metric most teams ignore: the gap between booked and held meetings.
Rep A books 20 meetings but only 12 show up. Rep B books 15 and 14 show up. Who's actually better? Rep B is qualifying harder upfront and wasting less time on no-shows.
Track both numbers:
- Meetings booked: Total appointments scheduled
- Meeting show rate: Percentage that actually happen
- Meetings held: The ones that count
A high show rate means better qualification. Our appointment setters maintain 70%+ show rates because we train them to book meeting-ready leads, not tire-kickers.
Win Rate Per Rep
This is your closer metric. Of all the opportunities a rep touches, what percentage do they close?
Calculate it simply: closed-won deals divided by total opportunities. Industry average hovers around 20-30% for B2B, but top performers hit 40%+ consistently.
If someone's win rate is significantly below team average, they either need coaching or they're getting lower-quality leads than everyone else. Figure out which.
Average Deal Size Per Rep

Two reps close the same number of deals. One averages $10K contracts, the other $50K. They're not performing equally.
Sales rep performance metrics must account for deal value, not just deal count. Track average contract value per rep to understand who's landing bigger fish.
This also shows you who should focus on enterprise vs SMB accounts.
Activity-to-Outcome Ratios
This is where activity meets reality. How much work does each rep need to do to generate results?
- Calls per meeting booked
- Emails per meeting booked
- Meetings per closed deal
- Touches per conversion
Rep C makes 200 calls to book 10 meetings. Rep D makes 150 calls for the same result. Rep D is more efficient. Maybe better targeting, better messaging, or better phone skills. Either way, now you know who to coach and who to learn from.
Why Output > Activity
Let's be direct: nobody cares how hard you worked if nothing came from it.
Activity metrics (calls made, emails sent, hours logged) measure effort. Sales productivity metrics measure results. And results are what matter.
We don't care if our cold callers make 50 calls or 500 calls per day. We care that they book 10-30 qualified appointments per month, guaranteed. That's the output that drives revenue.
Track activity to ensure minimum standards are met. But evaluate reps on outcomes: meetings booked, pipeline created, deals closed, revenue generated.
If someone's hitting output targets with half the activity of their peers, they're not slacking. They're working smarter. Study and replicate.
Also Check: Perfect B2B Sales Strategy to Close More Deals (Proven Methods)
🚀 Measure Meetings. Measure Money.
Stop guessing performance. We bring qualified meetings with clear reporting and attribution and you only pay for real sales opportunities.
Sales Productivity Metrics That Reveal Efficiency
Working hard and working smart aren't the same thing. Sales productivity metrics show you who's generating maximum output with minimum waste.
Revenue Per Rep
The simplest efficiency metric that exists: total revenue divided by number of sales reps.
If your team of 10 reps generates $2M annually, that's $200K per rep. If a competitor's team of 10 generates $3M, they're 50% more productive with the same headcount.
This metric cuts through everything else. It doesn't matter if someone makes more calls or sends more emails. What matters is revenue generated per person on your payroll.
Track it monthly and quarterly. When it drops, something in your sales process broke.
Meetings Per Hour / Per Week
Time is your most expensive resource. How efficiently are your reps converting it into opportunities?
- Meetings per week: Total first meetings held divided by number of reps
- Meetings per prospecting hour: Meetings booked divided by actual time spent prospecting
If Rep A books 8 meetings spending 20 hours prospecting and Rep B books 8 meetings in 10 hours, Rep B just freed up 10 hours for more prospecting or deal management. That's 50% more productive.
Our cold calling system guarantees 10-30 qualified appointments per month because we've optimized every step: trained setters, breakthrough scripts, power dialers, and proven targeting. No wasted motion.
Cost Per Meeting / Cost Per Deal
Every meeting and every deal has a price tag. Calculate it:
- Cost per meeting: Total sales costs (salaries, tools, overhead) divided by meetings booked.
- Cost per deal: Total sales costs divided by closed deals.
Let's say your in-house SDR costs $80K annually (salary + tools + management time) and books 200 meetings per year.
That's $400 per meeting. If your close rate is 20%, each deal costs $2,000 in sales expense.
Now compare that to alternatives.
Our LinkedIn services start at $397/month and our cold email campaigns charge only for meeting-ready leads delivered. Half the cost of in-housing for most companies, with guaranteed output.
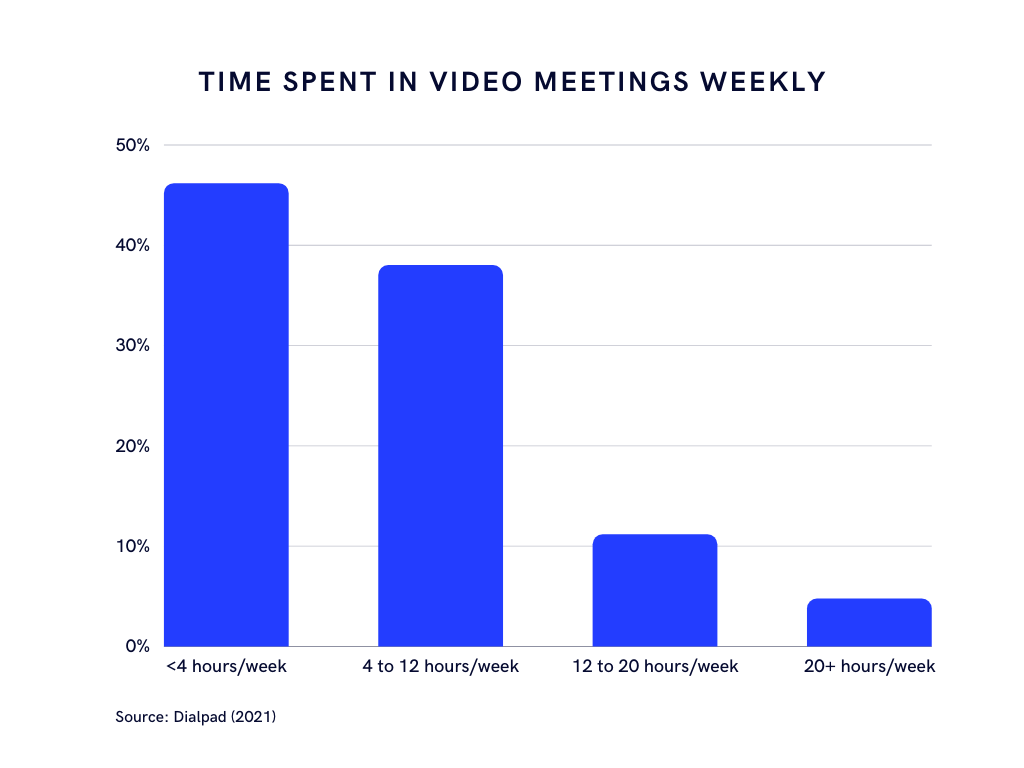
Time Spent Selling vs Admin Work
Here's the productivity killer nobody talks about: administrative burden.
Studies show sales reps spend only 28% of their time actually selling. The rest? CRM updates, internal meetings, research, proposal creation, scheduling, follow-ups.
Track how your reps allocate their time:
- Selling time: Actual prospect/customer conversations
- High-value non-selling: Deal strategizing, contract negotiation, proposal customization
- Low-value admin: Data entry, scheduling, administrative tasks
The goal isn't 100% selling time (that's unrealistic). The goal is maximizing high-value activities and minimizing low-value ones. Every hour spent on admin is an hour not generating revenue.
Sales productivity metrics expose these inefficiencies. Once you see them, you can fix them. Automate the admin, outsource the prospecting, and let your closers close.
Explore Further: Sales Enablement Strategy to Close More Deals
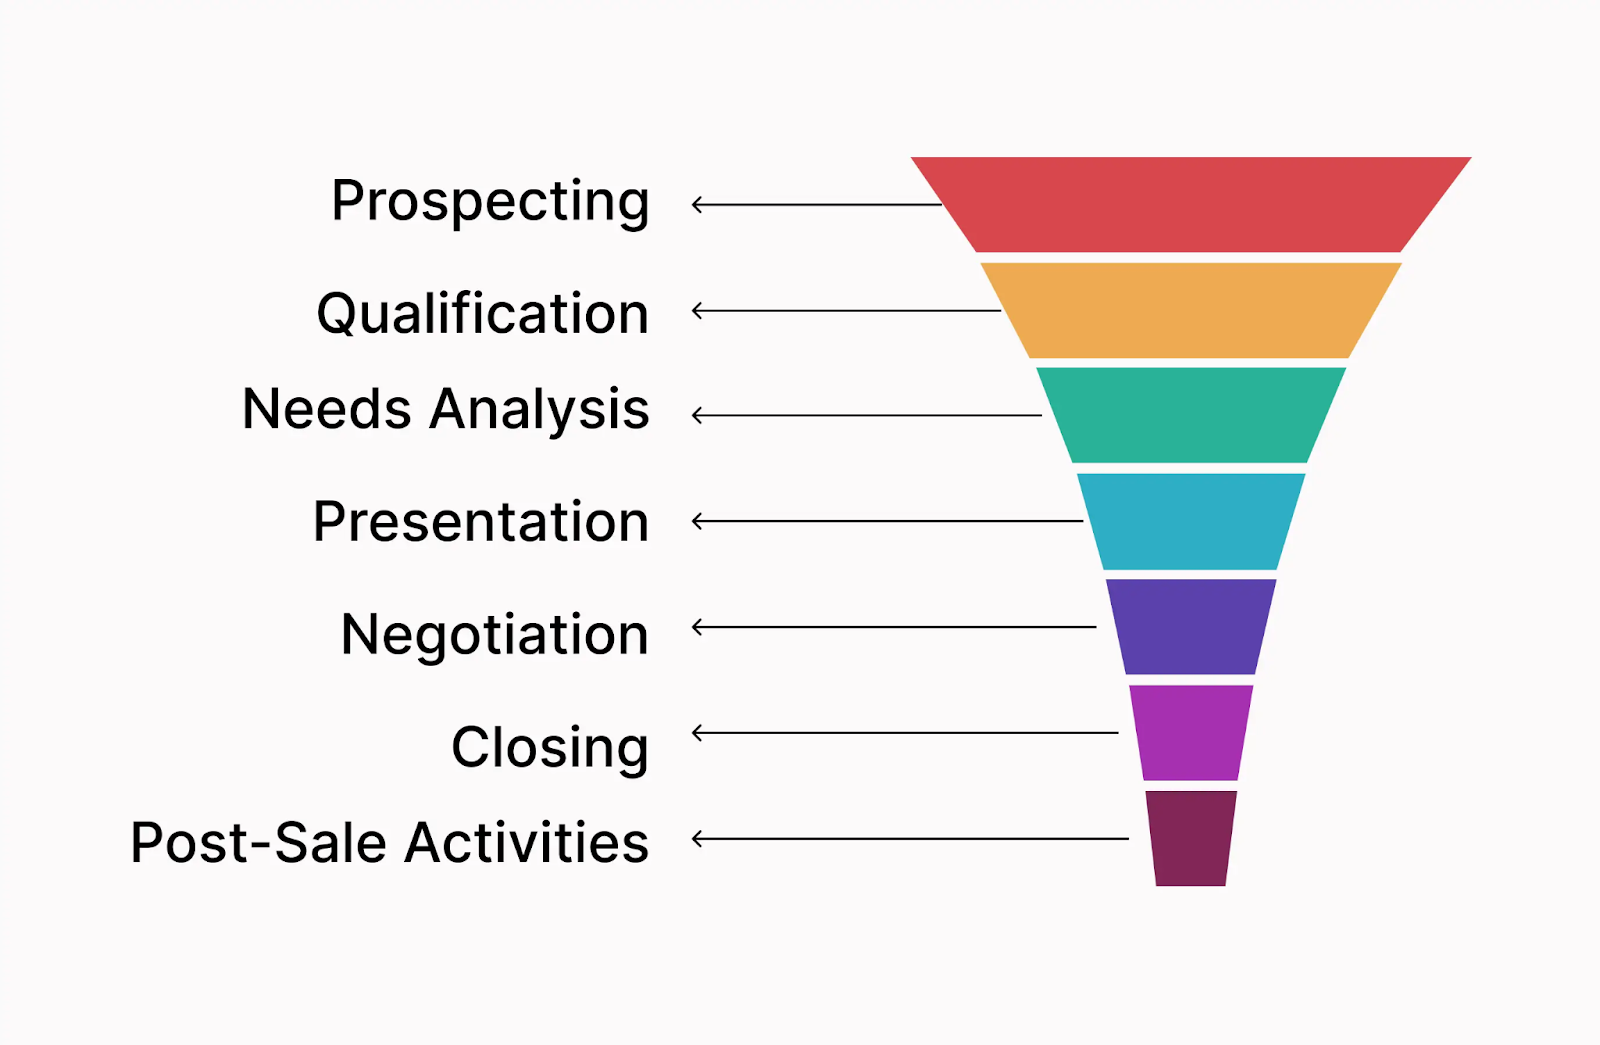
Sales Metrics Examples by Funnel Stage
Generic tracking doesn't work. You need sales metrics examples that map to specific lead gen funnel stages, because what matters at the top is completely different from what matters at the bottom.
Top of Funnel: Getting Attention
At this stage, you're reaching out cold. The metrics that matter:
- Reply rate: Percentage of outreach messages that get responses (cold email benchmark: 5-10%, LinkedIn: 20-30%)
- Connect rate: For LinkedIn, percentage of connection requests accepted (industry standard: 30-40%)
- Positive response rate: Replies that show genuine interest vs brush-offs
If your reply rates are below benchmarks, your messaging is off. Either wrong targeting, weak value prop, or both.
We've sent millions of LinkedIn messages and cold emails for clients, and the difference between 5% and 25% reply rates is usually one thing: relevance.

Mid-Funnel: Qualifying Interest
Now you've got responses. Can you turn them into real opportunities?
- Show rate: Percentage of booked meetings where prospects actually show up (target: 70%+)
- Qualification rate: Meetings that become qualified pipeline opportunities (healthy range: 40-60%)
- Meeting-to-opportunity conversion: How many first meetings advance to real deals
Low show rates mean poor qualification during booking. You're scheduling meetings with people who aren't serious.
Our cold calling team maintains high show rates because appointment setters are rigorously trained to identify meeting-ready leads, not just anyone willing to calendar a slot.
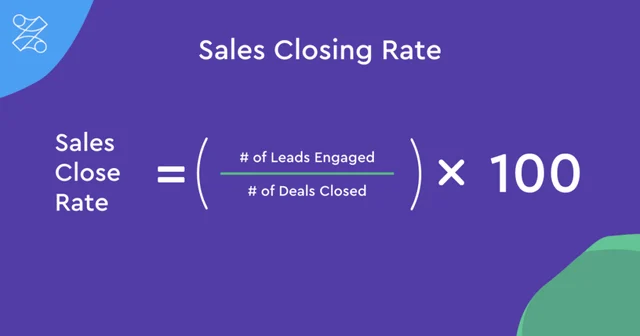
Bottom Funnel: Closing Deals
This is where everything either pays off or falls apart:
- Close rate: Opportunities that become closed-won deals (B2B average: 20-30%)
- Deal velocity: Average days from opportunity created to deal closed
- Win rate by deal size: Close rates broken down by contract value (often inverse correlation)
If close rates drop suddenly, diagnose fast. Is it pricing? Competition? Product fit? Sales skills? The answer changes your fix completely.
Deal velocity matters as much as close rate. A 25% close rate with a 90-day cycle beats a 30% close rate with a 120-day cycle when you calculate annual revenue capacity.
Why Metrics Must Be Stage-Specific
Here's why this matters: optimizing the wrong stage wastes time and money.
Your close rate is 35% (great!) but your reply rate is 2% (terrible). Investing in sales training won't help. You need better outreach.
Your reply rate is 25% (excellent!) but your show rate is 40% (bad). The problem isn't lead generation, it's qualification.
Sales metrics examples at each stage create a diagnostic map. When revenue drops, you can trace backward through the funnel to find the exact breaking point.
Top of funnel metrics predict what enters your pipeline. Mid-funnel metrics predict what becomes real opportunity. Bottom funnel metrics predict what becomes revenue.
Track all three. Fix the stage that's actually broken. That's how you measure and improve systematically instead of guessing.
Dive Deeper Into: Sales Outreach - How to Build a Scalable B2B Growth Engine
How Often Should You Measure Sales Performance?
Different metrics need different cadences. Track everything on the wrong timeline and you'll either overreact to noise or miss problems until it's too late.
Daily Tracking
Activity metrics only. Calls made, emails sent, meetings booked. These keep your team accountable but don't tell you much about success yet.
Weekly Reviews
Pipeline movement and conversion rates. What's advancing, what's stalled, where deals are getting stuck. This is your tactical adjustment window.
Monthly Analysis
Revenue, quota attainment, win rates, and sales productivity metrics. Monthly gives you enough data to spot real trends without quarterly lag time.
Quarterly Deep Dives
Full funnel analysis, rep performance comparisons, cost-per-acquisition, customer lifetime value. This is strategy time, not tactics.
The mistake most teams make? They track everything monthly or quarterly and wonder why problems blindside them. How to measure sales success includes knowing when to measure what. Leading indicators (pipeline, activity) get checked more often. Lagging indicators (closed revenue, LTV) get deeper but less frequent analysis.
Daily for activity. Weekly for pipeline. Monthly for outcomes. Quarterly for strategy. Stick to that rhythm and you'll catch issues early while avoiding analysis paralysis.
How to Build a Sales Success Dashboard That Drives Action
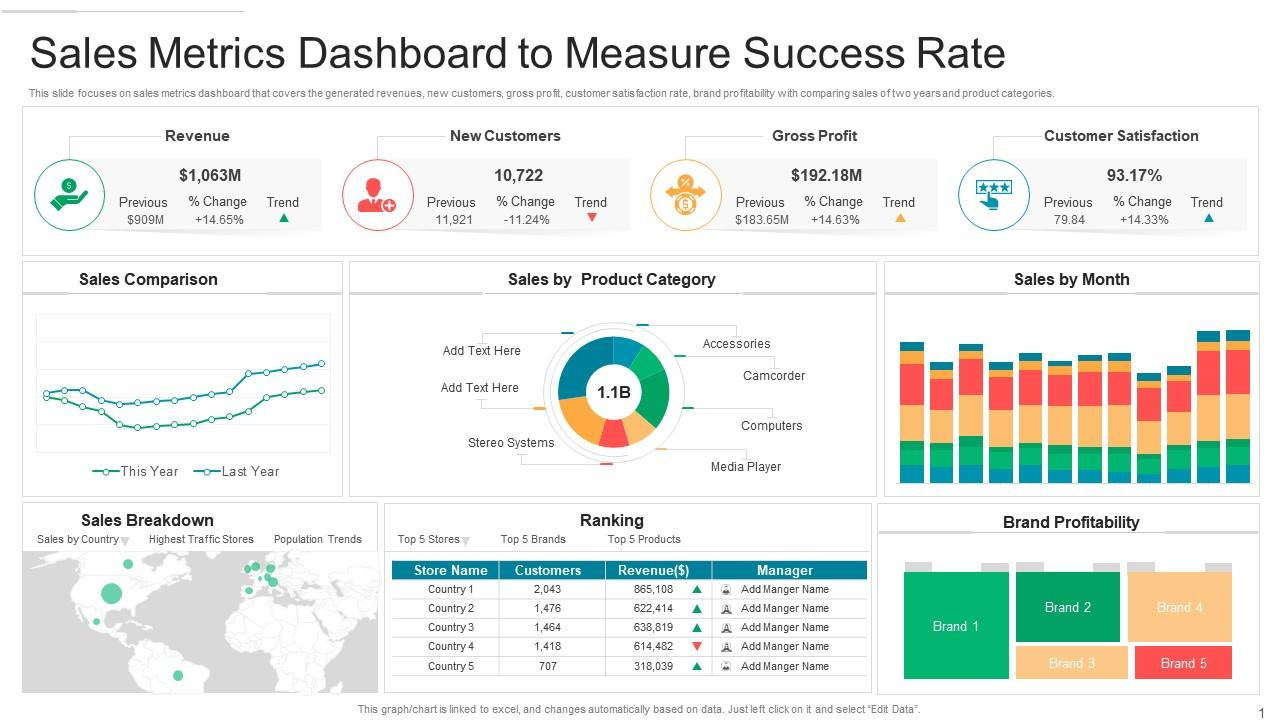
A dashboard full of numbers isn't useful. A dashboard that tells you what to do next is everything.
✅ Fewer Metrics, Clearer Insights
Your dashboard shouldn't require a PhD to understand. Pick 8-12 core metrics maximum. If you're tracking 30+ data points, nobody's actually using them.
Focus on metrics that directly impact revenue and can be acted on immediately. Everything else is noise.
✅ Leading vs Lagging Indicators
Balance both on every dashboard:
- Lagging indicators: Revenue closed, quota attainment, deals won (tell you what already happened)
- Leading indicators: Pipeline created, meetings booked, response rates (predict what's coming)
Lagging metrics show results. Leading metrics give you time to fix problems before they tank your quarter. How to measure sales performance effectively means watching both simultaneously.
✅ Aligning Sales, Marketing, and RevOps Views
Everyone needs different metrics, but they should connect:
- Sales: Individual rep performance, pipeline coverage, close rates
- Marketing: Lead quality, MQL-to-SQL conversion, campaign ROI
- RevOps: Full funnel efficiency, cost per acquisition, revenue per rep
When these teams track disconnected metrics, finger-pointing starts. "Marketing sends bad leads." "Sales can't close." Shared dashboards with overlapping metrics create accountability across the entire revenue engine.
At Cleverly, our clients see exactly how many meeting-ready leads we deliver, show rates, and pipeline generated. Complete transparency means aligned action.
✅ Turning Metrics into Decisions
A metric without an action is just trivia. Every number on your dashboard should answer: "What do I do about this?"
Pipeline coverage below 3x? Launch new outreach campaigns immediately. Close rate dropping? Review recent lost deals for patterns. Meeting show rate tanking? Tighten qualification criteria.
Build your dashboard around decisions, not data. The goal isn't to know everything. It's to know exactly what needs fixing right now.
How Cleverly Helps Teams Measure Sales Success Beyond Vanity Metrics
Most lead generation agencies will brag about thousands of emails sent or hundreds of connections made. We don't. Because those numbers don't pay your bills.
Qualified Conversations Over Raw Volume
We've made over 1 million cold calls and sent millions of LinkedIn messages for one reason: to book meetings that actually turn into revenue. Our cold calling system guarantees 10-30 qualified appointments per month.
Our LinkedIn and cold email campaigns? You only pay for meeting-ready leads we deliver.
No vanity metrics. No "we reached 10,000 people" reports that mean nothing. Just qualified conversations with decision-makers who showed up, engaged, and fit your ICP.

Clear Reporting: Lead → Meeting → Pipeline
Every client gets complete visibility into what matters:
- Leads contacted and response rates
- Meetings booked and actual show rates
- Pipeline created and revenue influenced
We've helped over 10,000 clients generate $312 million in pipeline revenue and $51.2 million in closed revenue because we measure what you measure: outcomes that impact quota.
Clean data, structured outreach, and rigorous training mean the metrics we track are actually reliable.
Ready to measure success that actually matters? Let's talk about filling your pipeline with qualified meetings, not just inflated activity reports.
Book a strategy call and see exactly how we'll measure success together.
Conclusion
Stop drowning in data that doesn't drive decisions.
How to measure sales success comes down to this: track the metrics that predict revenue, ignore the ones that just make you feel busy, and act on what the numbers tell you before problems become crises.
Revenue metrics show where you are. Pipeline metrics show where you're going. Conversion metrics show what's broken. Productivity metrics show who's efficient.
Track all four, measure at the right intervals, and turn insights into action.
Your dashboard should answer one question clearly: "What do we fix next?" If it doesn't, you're measuring wrong.
Now build a measurement system that actually moves the needle. Your quota depends on it.
Frequently Asked Questions
Free Resource
How to Scale a Profitable Cold Call System
Get the complete guide — download it instantly now.
Free Ebook
Download the Free Guide
Enter your details to get instant access.
You're all set! 🎉
Your ebook is downloading now.
Click below if the download didn't start automatically.