Table of Contents
What Are B2B Sales KPIs and Why They Matter
How to Choose the Right KPIs for Your B2B Sales Model
Core B2B Sales KPIs Every Team Should Track
Outbound-Specific B2B Sales KPIs Most Teams Miss
B2B Sales KPIs by Funnel Stage
Tools to Track and Measure B2B Sales KPIs
Common KPI Mistakes That Hurt B2B Sales Performance
How Cleverly Helps Teams Improve the B2B Sales KPIs That Matter
Conclusion
Frequently Asked Questions
Modified On :
April 10, 2026
Key Takeaways
- Track B2B sales KPIs that connect outbound effort to pipeline and revenue, not 50 vanity metrics that just look busy.
- Leading indicators (meetings booked, reply rates) predict future revenue while lagging indicators (close rates, CAC) confirm past performance.
- Separate outbound and inbound KPIs because they behave differently and require different benchmarks and strategies.
- Measure channel-level performance to know which outreach method (LinkedIn, email, calling) drives the best ROI for your ICP.
- Review leading indicators weekly and act immediately when metrics drop instead of waiting until poor results show up in closed deals.
- Focus on outcome metrics (qualified meetings, SQLs) over activity metrics (emails sent, calls made) to drive real revenue growth.
Most B2B sales teams drown in dashboards. You're tracking 47 metrics, generating weekly reports, and somehow still missing your revenue targets. Sound familiar?
Here's the problem: activity doesn't equal results. Your team made 500 calls last week? Great. But did those calls actually move deals forward?
The truth is, most B2B sales KPIs tell you what happened, not whether it mattered. You need metrics that draw a straight line from your outbound efforts to actual pipeline to closed revenue.
No vanity metrics. No busywork numbers that look good in slides but don't predict success.
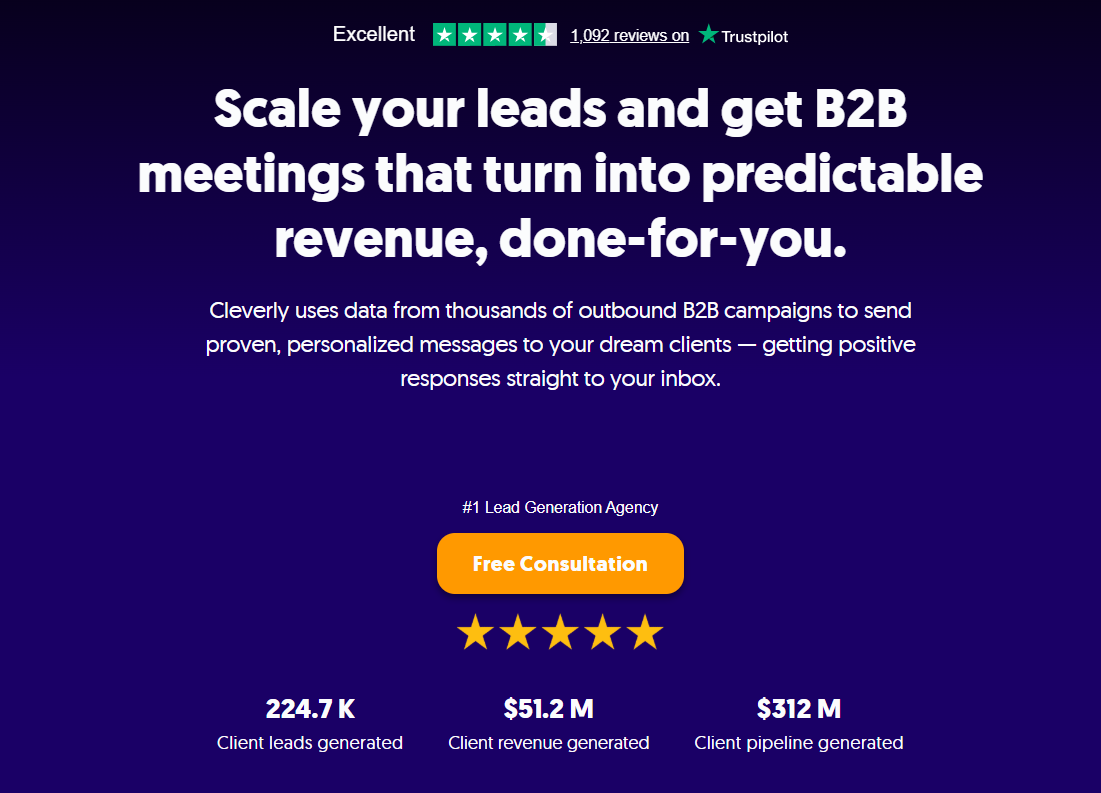
We've worked with over 10,000 companies to generate $312 million in pipeline, and we've learned something critical: the teams that hit their numbers obsess over the right 10 metrics. Not 50. Not even 20. Just 10 that actually matter.
This guide breaks down exactly which B2B sales KPIs your revenue team should track in 2026, why they matter, and how to use them to predict (and hit) your targets quarter after quarter.
What Are B2B Sales KPIs and Why They Matter
B2B sales KPIs are measurable indicators that tell you if your sales efforts are actually producing revenue. That's it. Not how busy your team looks. Not how many LinkedIn connections they sent. Just whether the work translates into closed deals.
What most teams get wrong is that they confuse vanity metrics with decision-making KPIs. Vanity metrics make you feel productive (500 emails sent!).
Real KPIs for B2B sales success tell you what to do next (12% reply rate means we need better targeting).
Why this matters more in outbound B2B
In inbound, leads come to you. In outbound, you control every variable: who you target, how you reach them, what you say. That means every metric should directly inform your next move. If a KPI doesn't change your strategy or predict revenue, stop tracking it.
The best sales teams track metrics that answer one question: are we getting closer to our revenue goal today than yesterday?
Learn More: Inbound vs Outbound Lead Generation: What Works Best?
🔥 KPIs That Actually Matter
Cleverly delivers meeting-ready leads across LinkedIn, cold email, and calling—so your numbers tie directly to revenue.
How to Choose the Right KPIs for Your B2B Sales Model
Not all KPIs work for every business. The best KPIs for b2b sales teams depend on three things: your average deal size, how long it takes to close, and whether you're running outbound or inbound motions.
Selling $5K deals with 30-day cycles? You need high-velocity metrics like daily conversations and weekly close rates.
Closing $500K enterprise deals over 9 months? You're tracking pipeline coverage, multi-threading, and stage progression.
Your company stage matters too:
- Early-stage teams should obsess over leading indicators like meeting volume and response rates. You need to learn what works fast.
- Scale-stage teams balance leading indicators with lagging metrics like win rates and customer acquisition cost. You're optimizing what already works.
Here's the key difference: Leading indicators (calls made, emails sent) predict future revenue. Lagging indicators (deals closed, revenue earned) confirm past performance. The best KPIs for B2B sales teams use both. Leading indicators tell you where you're heading. Lagging indicators prove you got there.
Match your KPIs to your reality, not someone else's playbook.
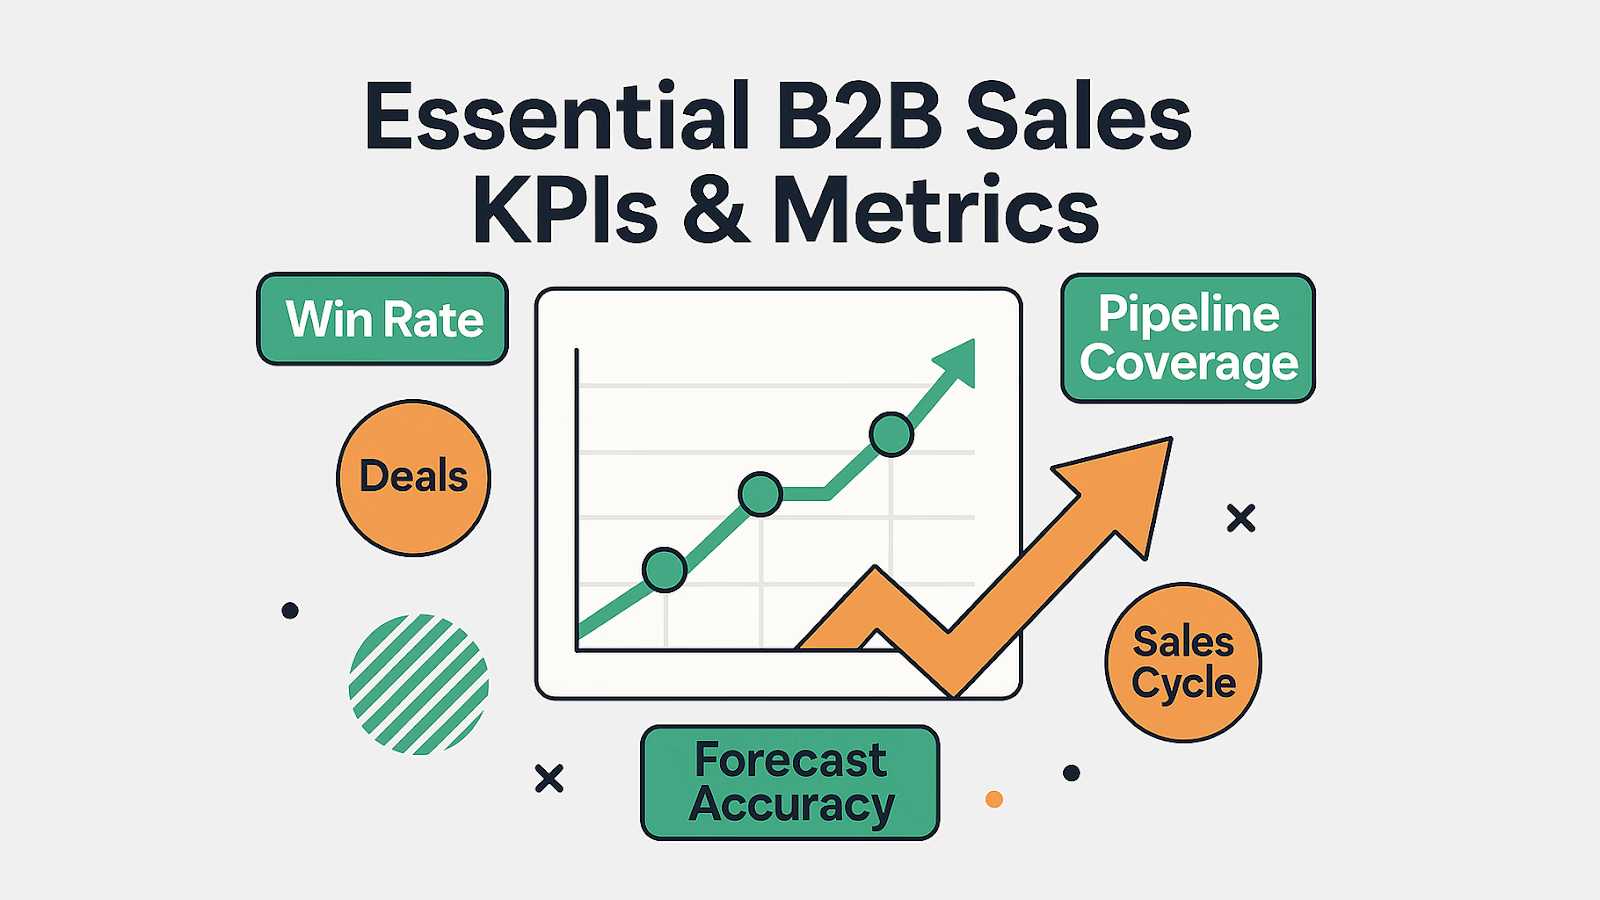
Core B2B Sales KPIs Every Team Should Track
These are the B2B sales KPIs that actually matter. Track these 10, and you'll know exactly where your revenue engine is strong and where it's leaking.
1. Meetings Booked per SDR
This tells you if your outbound is working. If one SDR books 15 meetings a month and another books 3, you've got a targeting problem, a messaging problem, or a performance problem. This metric cuts through the noise.
What good looks like: 10-20 meetings per SDR monthly for most B2B teams. If you're consistently below that, your list quality or outreach strategy needs work.
2. Meeting Show Rate
Booking meetings means nothing if prospects ghost you. Your show rate reveals lead quality and whether your pre-call nurturing actually works.
What good looks like: 60-80% show rate. Below 50%? You're either targeting the wrong people or not confirming meetings properly.
3. Lead-to-Meeting Conversion Rate
This is your diagnostic tool. Low conversion rates point directly to messaging problems, bad targeting, or weak offers. It's the first place we look when campaigns underperform.
What good looks like: 2-5% for cold outreach. Higher means your targeting is sharp. Lower means something in your message or audience is off.
4. Sales Qualified Leads (SQLs)
Not every meeting is worth taking. SQLs separate real opportunities from tire kickers. This metric shows whether your SDRs understand your ICP and can qualify properly.
What good looks like: 40-60% of meetings should convert to SQLs. If it's lower, tighten your qualification criteria before the meeting even happens.

5. Opportunity-to-Close Rate
This B2B sales KPI measures sales execution. Your AEs can't close? The problem isn't marketing. It's pitch, pricing, or process.
What good looks like: 20-30% for most B2B sales. Lower rates mean you're either pitching wrong or targeting wrong.
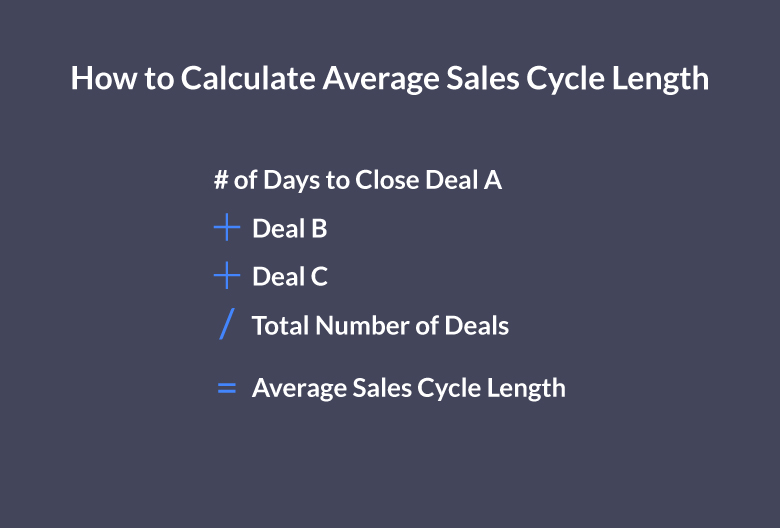
6. Average Sales Cycle Length
How long from first meeting to signed contract? This number drives your entire forecast. Shorter cycles mean faster revenue. Longer cycles mean you need more pipeline coverage.
What good looks like: Depends on deal size, but track trends. If cycles are lengthening, something's creating friction in your process.
7. Pipeline Value Generated per Month
Are you creating enough pipeline to hit your revenue targets? This is the ultimate health check for your outbound motion.
What good looks like: You need 3-5x your monthly revenue goal sitting in pipeline. If you're aiming for $500K in quarterly revenue, you should generate $500K-$800K in new pipeline monthly.
8. Cost per Qualified Meeting
Forget cost per lead. What matters is what you pay for a real conversation with a qualified buyer. This metric tells you if your outbound investment makes sense.
What good looks like: $100-$300 for most B2B teams. At Cleverly, our cold email clients only pay for meeting-ready leads we actually deliver.
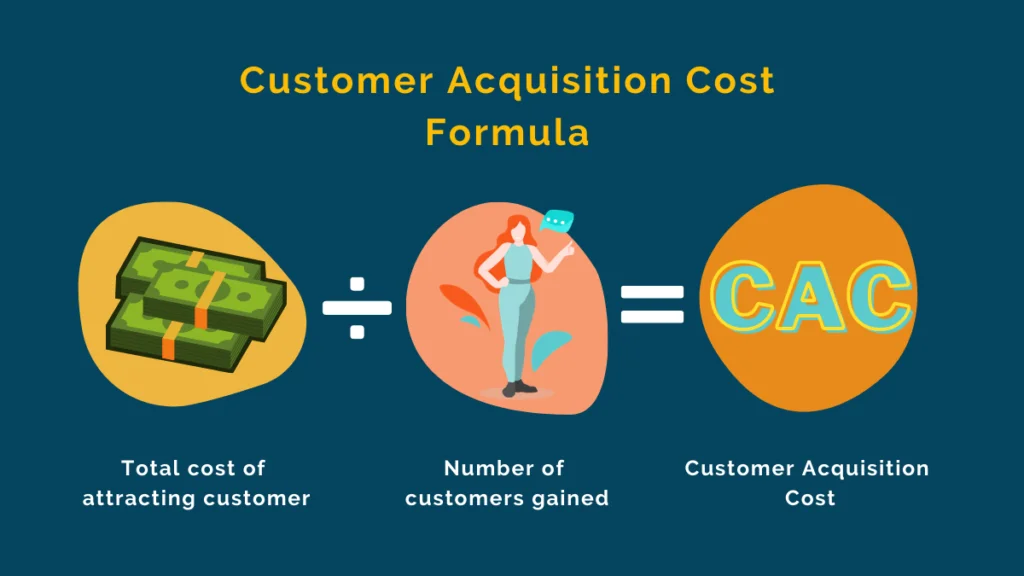
9. Customer Acquisition Cost (CAC)
Total sales and marketing spend divided by new customers. This tells you if you can afford to scale. High CAC with low deal values? You're losing money on every customer.
What good looks like: Your CAC should be recovered within 12 months of closing the customer. Longer payback periods strain cash flow.
Also Check: The Perfect B2B Sales Strategy to Close More Deals (Proven Methods)
10. Lifetime Value to CAC Ratio (LTV:CAC)
This ratio determines if your sales model is sustainable. It shows whether the revenue a customer generates over their lifetime justifies what you spent to acquire them.
What good looks like: 3:1 minimum. Below that, you're spending too much to acquire customers. Above 5:1 means you should probably spend more on acquisition because your unit economics are strong.
These KPIs for B2B sales success work together. Track them weekly, and you'll spot problems before they tank your quarter.
🚀 Measure What Makes Money
We bring qualified meetings with clear reporting and attribution. You only pay for real sales opportunities.
Outbound-Specific B2B Sales KPIs Most Teams Miss
Most B2B sales KPIs dashboards stop at meetings booked. But the best outbound teams dig deeper. Here are the metrics that separate good campaigns from great ones.
Reply Rate vs Positive Reply Rate
Your reply rate includes every "not interested" and "remove me." Your positive reply rate only counts replies that move conversations forward. Big difference.
Why it matters: A 15% reply rate sounds great until you realize 12% are rejections. Positive reply rate (usually 2-5% for cold outreach) tells you if your message actually resonates. Track both to diagnose whether you have a volume problem or a messaging problem.

Follow-Up Effectiveness
Most meetings come from follow-ups, not first touches. But most SDRs give up after one or two attempts.
What to track: Response rate by touch number. If your 4th follow-up converts better than your 2nd, you're not following up enough. We've seen campaigns where 60% of meetings came from touches 3-7.
Touches Required to Book a Meeting
How many times do you need to reach out before someone says yes? This metric determines your campaign length and cadence strategy.
What good looks like: 6-8 touches on average for B2B. If you're booking meetings on touch 2, your targeting is exceptional. If it takes 12+ touches, either your message isn't landing or you're reaching the wrong people.

Channel-Level Performance
Not all channels perform equally. LinkedIn might book meetings at $150 each while cold calling costs $400. You need to know which channel drives the best results for your ICP.
What to track:
- Meeting conversion rate by channel
- Cost per meeting by channel
- Show rate by channel
- SQL rate by channel
With our LinkedIn outreach starting at $397/month and cold calling services that guarantee 10-30 qualified appointments monthly, we help clients track exactly which channel performs best for their specific market. The right tools to measure outbound B2B sales KPIs show you where to double down and where to cut spend.
Without channel-level data, you're flying blind. One channel might be crushing it while another drains your budget.
Here’s More: Sales Outreach - How to Build a Scalable B2B Growth Engine
B2B Sales KPIs by Funnel Stage
The KPIs for B2B sales success change depending on where prospects are in your lead gen funnel. Here's what to track at each stage.
Top of Funnel: Are You Starting Conversations?
At this stage, you're just trying to get responses from cold prospects.
Track these metrics:
- Connect rate: Are people accepting your LinkedIn requests or opening emails?
- Reply rate: Are they responding to your outreach?
- Engagement rate: Are they clicking links, visiting your site, or watching your videos?
Low numbers here mean your targeting or first impression needs work. You're not even getting in the door.
Middle of Funnel: Are You Converting Interest into Opportunities?
Now you've got attention. Can you turn it into real sales conversations?
Track these metrics:
- Meetings booked: How many conversations are you scheduling?
- Show rate: How many prospects actually show up?
- SQL rate: How many meetings turn into qualified opportunities?
This is where most outbound campaigns live or die. If you're booking meetings but they're not showing up or qualifying, you've got a targeting problem, not a volume problem.
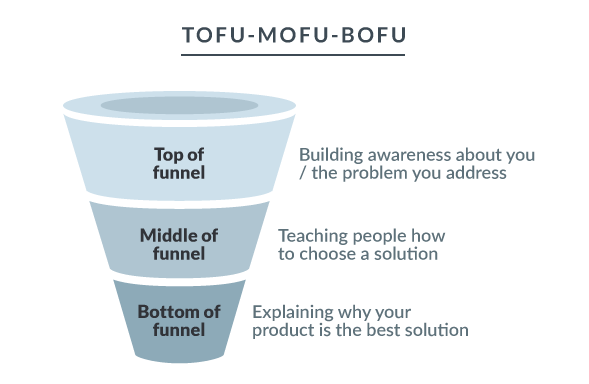
Bottom of Funnel: Are You Closing Deals?
You've got qualified opportunities. Time to prove your sales team can execute.
Track these metrics:
- Opportunity-to-close rate: What percentage of SQLs become customers?
- Average deal size: Are you closing the deal sizes you forecasted?
- Sales cycle length: How long from SQL to signed contract?
These KPIs for B2B sales success reveal whether your pitch, pricing, and process actually work. Great top-of-funnel numbers with poor close rates? Your sales execution needs attention.
Post-Sale: Are Customers Staying and Growing?

Revenue doesn't stop at the signature. The best B2B companies grow accounts over time.
Track these metrics:
- Churn rate: What percentage of customers leave each year?
- Expansion revenue: How much are existing customers spending compared to their initial deal?
- Referral rate: How many customers refer new business?
High churn kills growth. But high expansion revenue and referrals? That's proof your product delivers and your customers become advocates.
Map your metrics to funnel stages, and you'll know exactly where to focus your team's energy.
Also Check: SaaS Sales Funnel - How to Turn Cold Prospects into Paying Customers
Tools to Track and Measure B2B Sales KPIs
You can't improve what you don't measure. Here are the tools to measure outbound B2B sales kpis that actually work.
CRMs: Your Single Source of Truth
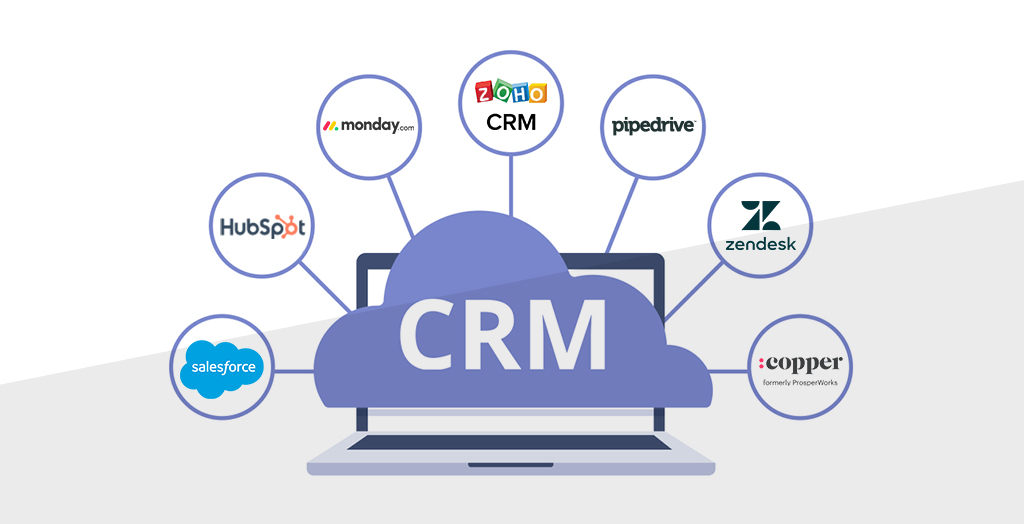
HubSpot and Salesforce are the backbone of B2B sales tracking. They centralize your pipeline data, track deals through stages, and show you which activities lead to revenue.
Pick one, set it up properly, and make sure your team actually uses it.
Outreach and Sequencing Platforms
Tools like Apollo, Salesloft, and Outreach automate your cadences and track engagement metrics. They show you reply rates, open rates, and which messages get responses.
You'll know exactly which sequences work and which ones waste time.
Also Check: How to Choose the Best Cold Email Outreach Software for Your Sales Team
Call Analytics Tools
Gong and Chorus record calls, analyze conversations, and surface patterns in what wins and loses deals. They catch objections your team isn't logging in the CRM and show you which talk tracks actually close business.
In Detail: Best Call Tracking Software to Improve Lead Quality & Close Rates
Revenue Reporting Dashboards
HubSpot dashboards and CRM custom reports pull everything together. Build views that show pipeline coverage, meeting volume trends, and forecasted revenue. Your exec team needs to see the full picture in under 60 seconds.
The best tools to measure outbound B2B sales KPIs integrate with each other. Your outreach platform should feed your CRM, which feeds your reporting dashboard. No manual data entry. No spreadsheet gymnastics.
At Cleverly, we handle the outbound execution and tracking for you. Our LinkedIn and cold email services integrate with your existing tech stack, and our cold calling team uses enterprise dialers with built-in analytics. You get clean data and qualified meetings without adding more tools to manage.
Pick tools that fit your workflow, not the other way around.
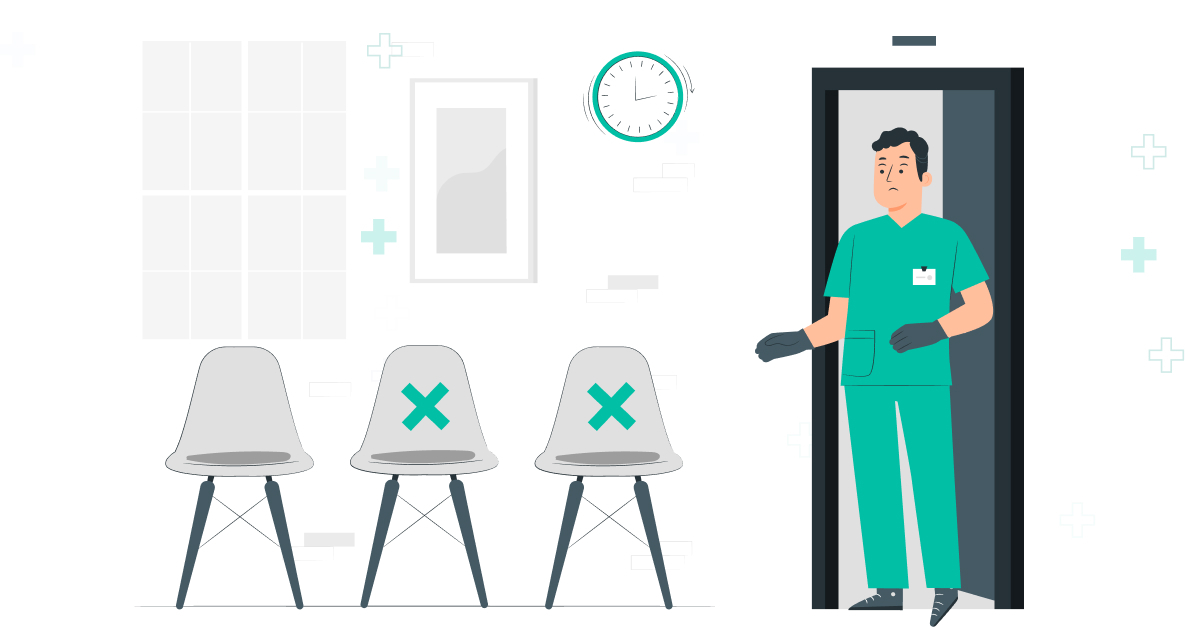
Common KPI Mistakes That Hurt B2B Sales Performance
Even teams that track B2B sales KPIs make costly mistakes. Here's what kills performance.
❌ Tracking Activity Instead of Outcomes
Your SDR made 100 calls today. Great. Did any of them book meetings? Activity metrics feel productive, but they don't predict revenue. Calls made don't matter. Conversations that move deals forward do.
✅ The fix: For every activity metric, pair it with an outcome metric. Track calls made AND meetings booked. Emails sent AND positive replies received.
❌ Not Separating Outbound vs Inbound KPIs
Inbound leads behave differently than outbound prospects. Lumping them together hides what's actually working. Your inbound conversion rate might be 15% while outbound is 3%, and that's normal. But combined, you can't tell which motion needs help.
✅ The fix: Split your dashboard. Track outbound and inbound separately so you know where to invest.
❌ No Benchmark Targets
Tracking metrics without targets is pointless. Is a 4% reply rate good or bad? You can't tell without a benchmark.
✅ The fix: Set realistic targets based on your industry and deal size. Then measure against them weekly. If you're consistently below benchmark, something needs to change.
❌ Measuring Too Late in the Funnel
If you only track closed deals, you're diagnosing problems three months too late. By the time you notice low close rates, you've already wasted a quarter on bad pipeline.
✅ The fix: Track leading indicators at the top of the funnel. Reply rates and meeting volume tell you next month's story. Close rates tell you last quarter's story.
❌ Not Acting on KPI Insights
The biggest mistake? Tracking everything and doing nothing. Your show rate dropped from 70% to 45% over two months. Did you investigate why? Did you change your confirmation process?
✅ The fix: Review KPIs weekly with your team. When a metric moves, ask why and adjust immediately. Data without action is just noise.
Stop making these mistakes, and your B2B sales KPIs will actually drive performance instead of just filling dashboards.
How Cleverly Helps Teams Improve the B2B Sales KPIs That Matter
Most B2B lead generation agencies promise results. We guarantee them.
We've helped over 10,000 clients generate $312 million in pipeline revenue and $51.2 million in closed revenue. Companies like Amazon, Google, Uber, PayPal, Slack, and Spotify trust us to fill their pipelines with qualified meetings.
Here's how we move the KPIs that matter:
📌 LinkedIn Lead Generation – Starting at just $397/month, we run targeted outreach campaigns that book meetings with your ideal buyers. No spray and pray. Just strategic messaging to decision-makers who actually need what you sell.
📌 Cold Email Lead Generation – You only pay for meeting-ready leads we send you. No wasted budget on unqualified contacts. We handle the targeting, messaging, and follow-ups. You show up to qualified conversations.
📌 Cold Calling Services – Our $5M cold calling system books you 10-30 qualified sales calls every month, guaranteed. We place a no-accent appointment setter, train them in 2 weeks, write breakthrough scripts, and include all the data, tech, and power dialers. It's half the cost of in-housing, and if we don't hit your meeting targets, we replace the SDR. We've made over 1 million cold calls and set 53,000 appointments.
The difference?
We don't just generate activity. We generate the B2B sales KPIs that predict revenue: qualified meetings, high show rates, and SQLs that actually close.

Ready to get 10-30 qualified leads per month? Let's talk!
Conclusion
B2B sales KPIs don't matter unless they change what you do tomorrow.
Most teams track 50 metrics and still can't tell you why they missed their quarter. The best teams track 10 metrics that connect outbound effort directly to pipeline and revenue. They know exactly where deals are won and lost.
Stop drowning in dashboards. Start tracking the metrics that actually predict growth. Fewer numbers. Better decisions. Faster optimization.
When you measure what matters and act on it weekly, growth becomes predictable. You're not hoping to hit your number. You know you will because your leading indicators already told you so.
Track the right KPIs. Act on the insights. Watch your revenue compound.
Frequently Asked Questions
Free Resource
How to Scale a Profitable Cold Call System
Get the complete guide — download it instantly now.
Free Ebook
Download the Free Guide
Enter your details to get instant access.
You're all set! 🎉
Your ebook is downloading now.
Click below if the download didn't start automatically.