Table of Contents
What Is Email Deliverability?
Key Email Deliverability Benchmarks at a Glance (2026)
35+ Email Deliverability Statistics in 2026
What These Statistics Mean for Your Cold Email Program
How to Improve Your Email Deliverability Using These Benchmarks
How Cleverly Helps B2B Companies Fix Deliverability and Book More Meetings
Conclusion
Frequently Asked Questions
Modified On :
July 8, 2026
Key Takeaways
- The average global inbox placement rate sits at 83.1%, and most of that loss is invisible since there's no bounce or error to flag it.
- Bounce rate and spam complaint rate are the two metrics that actually control your inbox placement. Keep bounces under 2% and complaints under 0.1% if you want consistent delivery.
- SPF, DKIM, and DMARC are no longer optional extras. Emails with full authentication are over 3x more likely to land in the inbox than unauthenticated sends.
- Cold email reply rates have compressed hard: the 2026 average sits at 3.43%, with top quartile senders hitting 5.5%+ and elite campaigns clearing 10%.
- Most deliverability failures trace back to infrastructure (domain setup, warm-up, list hygiene) not copywriting. Fix the plumbing before you touch the subject line.
Everyone obsesses over subject lines. Send times, personalization hooks, the perfect opening line. Almost nobody checks whether the email actually got read by a human being.
Here's the number that should change that: roughly 1 in 6 emails sent globally never reaches the inbox. The average marketing email inbox placement rate in 2026 sits at 83.1% across all industries and ESPs, according to a 15-ESP benchmark from EmailTooltester.
That's not spam you can see bouncing back. It's pipeline, follow-ups, and revenue disappearing with zero error message and zero warning.
For cold email specifically, the picture gets more volatile. Reply rates have dropped from 8.5% in 2019 to 3.43% in 2026, and a big chunk of that decline isn't buyer fatigue. It's deliverability degrading underneath campaigns that look fine on paper.
This post is for cold email teams, SDRs, and outbound marketers who want real email deliverability statistics to benchmark against, not vague advice about "sending better emails."
We're covering inbox placement, bounce rates, spam thresholds, authentication adoption, and cold email specific benchmarks so you know exactly where your program stands in 2026.
What Is Email Deliverability?
Email deliverability is whether your email actually lands in the primary inbox, not whether a mail server technically accepted it.
Those are two different things, and mixing them up is where most email deliverability statistics get misread.
- Delivery rate: the receiving mail server said "got it" and didn't bounce the message. This is a technical handshake, nothing more.
- Inbox placement rate: the message actually landed in the primary inbox, not spam, not promotions, not quarantined.
You can have a 99% delivery rate and a 65% inbox placement rate at the same time. The gap between those two numbers is where your open rates, reply rates, and booked meetings quietly disappear.
Every email you send lands in one of three places: the inbox, the spam/junk folder, or it bounces/gets blocked outright. If you're only tracking the first metric, you have no idea which of those three is actually happening to your sends.
Why this matters for B2B outreach: open rates and reply rates are meaningless if the email never reached a human. Deliverability is the pre-condition for every other cold email metric you track.
📧 Deliverability Is the Difference Between 0 and 30 Meetings
Our experts optimize inbox placement, targeting, and copy to generate 15–30 qualified meetings every month.
Key Email Deliverability Benchmarks at a Glance (2026)
Use this table to benchmark your own numbers before digging into the individual stats below.
35+ Email Deliverability Statistics in 2026
We've grouped these by category so you can jump to whatever's most relevant to your program right now.
Overall Inbox Placement Statistics
- Roughly 16.9% of emails sent globally never reach the inbox — they land in spam or get blocked entirely.
- The average marketing email inbox placement rate sits at 83.1% globally across ESPs, and that number has actually been sliding, not climbing.
- The mining industry has the highest email deliverability rate at 98%, while software struggles with one of the lowest rates at just 80.9% inbox placement.
- Google leads all major ESPs with 87.2% inbox placement and the lowest undelivered rate, while Microsoft Outlook has the lowest deliverability at 75.6% among major providers.
- B2B email programs generally outperform B2C on inbox placement because of lower volume, tighter targeting, and lower complaint rates.
- Well-run, authenticated opt-in programs with clean lists typically run 85–95%+ inbox placement, while unauthenticated senders can fall to 30–50%.
Bounce Rate Statistics
- The cross-industry average bounce rate in 2026 is approximately 1.2% for well-maintained lists, but teams with poor list hygiene regularly see 5–10%+ bounce rates.
- The acceptable bounce rate threshold sits under 2% — anything higher signals a real data quality problem, not a fluke send.
- Even a 0.5% hard bounce rate can start damaging sender reputation if it's left unaddressed for multiple sends.
- B2B contact data decays at roughly 22.5% per year, and up to 70% in fast-moving sectors like tech startups — a list that was clean 12 months ago has already degraded meaningfully.
- Teams that verify emails in real time achieve bounce rates around 0.3% and inbox placement near 95%, compared to 6.5%+ bounces for teams that never clean their lists.
- B2B bounce rates typically run about 0.7 percentage points higher than B2C, largely because professional contacts change jobs and companies restructure faster than consumer data changes.

Spam Rate and Complaint Rate Statistics
- Google and Yahoo's 2024 bulk sender requirements mandate a spam complaint rate below 0.10% to maintain reliable inbox placement, and that threshold is still in force in 2026.
- At 0.30% spam complaints, Gmail begins actively routing mail to spam. By the time you hit that number, damage is already underway.
- Complaint rate trend matters more than a single snapshot. A program sitting at 0.12% complaints is fine; the same program climbing 10% month-over-month is heading for trouble.
- Unsolicited or poorly targeted sends generate spam complaints at several times the rate of genuinely opted-in or well-targeted outreach.
- One-click unsubscribe, now required by major providers under RFC 8058, has measurably reduced spam complaints among senders who implemented it correctly.
- Mining and low-volume, highly targeted industries post the lowest spam complaint rates. Retail and e-commerce, which send high volume to broad lists, post the highest.
Authentication and Technical Statistics (SPF, DKIM, DMARC)
- Only about 33.4% of top websites have a proper DMARC record in place, despite major providers requiring authentication for bulk senders.
- Of domains that do have DMARC, the majority still sit at p=none (monitoring only) rather than p=reject, meaning they're watching for abuse but not actually blocking it.
- Emails with SPF, DKIM, and DMARC all properly aligned are over 3x more likely to reach the inbox than unauthenticated sends.
- Google and Yahoo's 2024 bulk sender requirements mandate SPF, DKIM, and DMARC for any sender exceeding 5,000 emails per day to personal accounts, and enforcement has only gotten stricter since. As of late 2025, Gmail moved to hard-rejecting non-compliant bulk mail outright instead of just filtering it to spam.
- Sending from a custom, dedicated domain instead of a free ESP subdomain meaningfully improves inbox placement for cold outreach.
- BIMI adoption (the brand logo you see next to some senders in Gmail) continues climbing, though it only functions once DMARC is set to p=quarantine or p=reject, which is exactly the enforcement level most senders skip.

Cold Email Deliverability and Performance Statistics
- Elite cold email campaigns exceed a 10% reply rate in 2026, top quartile senders hit 5.5%, and the average reply rate across all industries is 3.43%.
- A good cold email bounce rate in 2026 is under 3%, with best-in-class senders staying below 1.5%.
- Spam complaint rates for cold email need to stay under 0.3% to avoid deliverability damage, with the strongest senders holding below 0.1%.
- The average B2B cold email open rate in 2026 sits around 44%, with good performance in the 40–60% range and top campaigns clearing 65%+ — though open rate is an increasingly unreliable metric since Apple Mail Privacy Protection auto-opens tracking pixels for roughly half of all recipients.
- Email warm-up on new domains significantly cuts spam folder placement during the first several weeks of sending, which is exactly when reputation gets built or broken.
- Elite senders limit daily send volume to 30–50 emails per mailbox and rotate across multiple inboxes to protect reputation at scale.
- Follow-up emails matter more than most reps assume: about 58% of all replies come from the first email in a sequence, but the remaining 42% come from follow-ups — meaning a one-touch campaign leaves nearly half its replies on the table.
Email Volume and Sending Behavior Statistics
- Roughly 392.5 billion emails are sent and received daily worldwide in 2026, and nearly 48% of that volume is spam — about 188 billion junk emails a day, most filtered before they ever reach an inbox.
- Tuesday and Wednesday consistently produce the highest reply rates for B2B cold email, with Wednesday typically on top.
- Personalized cold email outreach shows a real, measurable lift: emails tailored to the recipient see roughly 32% higher response rates, and customized subject lines improve opens by around 50%.
- Best-performing cold email campaigns keep messages under 80 words and A/B test new copy weekly rather than running one script for months.
- Smaller, tightly targeted lists consistently beat volume: campaigns under 50 recipients average a 5.8% reply rate compared to 2.1% for large, broad sends.
Industry-Specific Email Deliverability Benchmarks
- Mining and natural resources post the highest inbox placement of any industry, largely due to low volume and highly targeted lists.
- B2B SaaS runs around 80.9% inbox placement, one of the more volatile sectors due to inconsistent authentication practices across the category.
- Reply rates vary sharply by industry: recruiting and staffing lead at 4–8% average (8–12% top quartile), while enterprise SaaS and healthcare sit at the lower end around 1–3%.
- Retail and e-commerce consistently post some of the lowest inbox placement rates industry-wide, driven by high send volume and aggressive promotional frequency.
- Financial services and legal tend to hold stronger inbox placement thanks to compliance-driven list hygiene, even though it limits how aggressively they can personalize.
🚀 Better Inbox Placement. Better Pipeline.
Join 10,000+ businesses using Cleverly's done-for-you cold email campaigns to turn delivered emails into qualified opportunities.
What These Statistics Mean for Your Cold Email Program
These numbers aren't trivia. Each one is a diagnostic.
If your bounce rate is above 3%, your list needs verification before your next send, full stop. If spam complaints are creeping past 0.1% in Postmaster Tools, the issue is targeting or messaging, not your subject line.
If you're sitting at 60% inbox placement while the top quartile hits 90%+, that gap isn't luck. It's authentication, warm-up, list hygiene, and sending cadence working together, or not.
The part that surprises most teams: the majority of cold email deliverability failures are infrastructure failures, not messaging failures. Domain setup, warm-up schedules, and verification fix more broken campaigns than a better opening line ever will.
You can rewrite a subject line in five minutes. Rebuilding a domain's sender reputation takes 30-60 days minimum.
And the sending environment keeps getting less forgiving. Since Gmail moved to hard-rejecting non-compliant bulk mail in late 2025, senders who skip baseline authentication aren't just landing in spam anymore. They're not being delivered at all.
How to Improve Your Email Deliverability Using These Benchmarks
✅ Authenticate properly. SPF, DKIM, and DMARC set to p=quarantine or p=reject is the floor, not a nice-to-have, for reliable inbox placement in 2026.
✅ Verify your list before every send. Target a bounce rate under 2% using multi-source verification, not a single provider's check.
✅ Warm up new domains and inboxes. New sending email infrastructure needs 4-8 weeks of gradual warm-up before campaign-volume sending. Skipping this is the single most common cause of new domains landing in spam.
✅ Watch your complaint rate, not just your bounce rate. If you're above 0.1% in Google Postmaster Tools, pull back volume and revisit targeting before you send another batch.
✅ Cap daily volume per inbox. 30-50 emails per inbox per day is the safe range. Scale through inbox rotation, not higher per-inbox volume.
✅ Send sequences, not single emails. With 42% of replies coming from follow-ups, a one-touch send leaves almost half your pipeline uncontacted.
✅ Personalize the subject line and first line. This is the highest-ROI lever on this list, with double-digit lifts in both opens and replies.
How Cleverly Helps B2B Companies Fix Deliverability and Book More Meetings
Most cold email programs don't fail because the copy is weak. They fail because nobody's watching the infrastructure underneath it, the domain setup, the warm-up schedule, the authentication records, the list hygiene. That's the part that actually determines whether your emails get read at all.
That's exactly what we handle end-to-end with Cleverly's done-for-you cold email service. We manage ICP targeting and verified list building, multi-domain sending infrastructure, warm-up, authentication, sequence copywriting, and deliverability monitoring, so campaigns are built to beat the benchmarks in this post rather than just meet them.
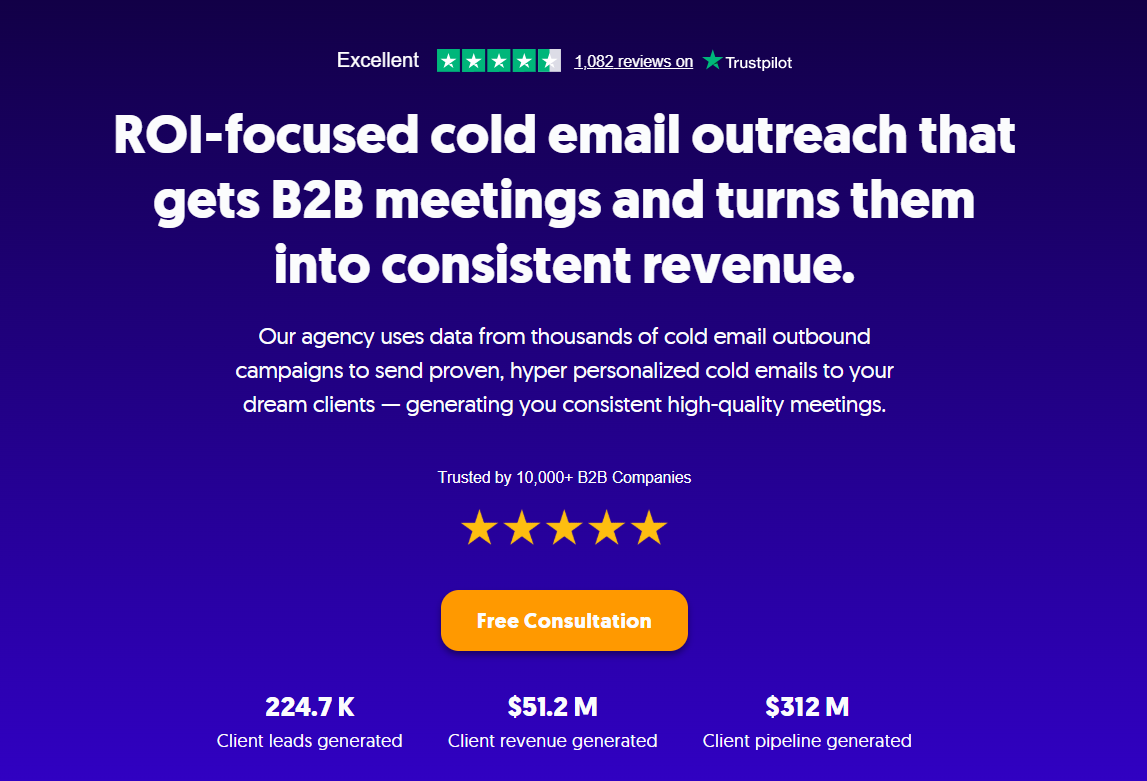
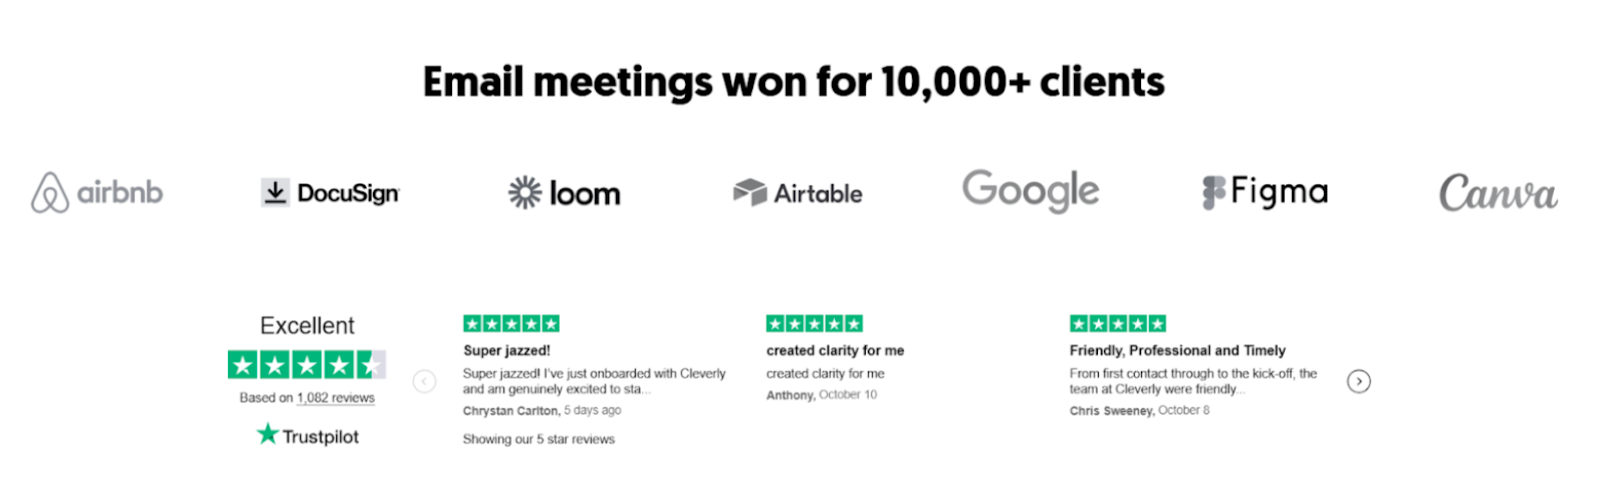
We've generated $312 million in pipeline and $51.2 million in closed revenue for clients across LinkedIn and cold email combined, working with companies like Amazon, Google, Uber, PayPal, Slack, and Spotify.
That track record comes from treating deliverability as infrastructure to manage daily, not a setting you configure once and forget.
The difference between running cold email on a tool versus partnering with an agency comes down to who's watching the numbers. A tool hands you dashboards and expects you to interpret them. Our team monitors bounce rates, complaint thresholds, and inbox placement across hundreds of live campaigns, so the output isn't raw send volume, it's qualified replies landing on your calendar.
Want a cold email program built to hit best-in-class deliverability from day one? Book a strategy call with Cleverly and we'll walk through what your current setup is actually costing you.
Conclusion
Email deliverability is the pre-condition for every cold email metric you actually care about. Open rates, reply rates, booked meetings, all of it sits downstream of whether your emails reach the inbox in the first place.
The benchmarks in this post give you a clear read on what good looks like in 2026: 90%+ inbox placement, sub-2% bounce rates, sub-0.1% complaint rates, and authentication set up correctly across every domain you send from.
The gap between an average sender and an elite one almost never comes down to luck or a clever subject line. It comes down to infrastructure, list hygiene, and cadence control, the unglamorous stuff nobody wants to spend time on until their reply rate quietly craters.
Use these numbers to figure out where your program actually stands today, and fix that before you touch anything else.
Frequently Asked Questions
Free Resource
How to Scale a Profitable Cold Call System
Get the complete guide — download it instantly now.

Free Ebook
Download the Free Guide
Enter your details to get instant access.
You're all set! 🎉
Your ebook is downloading now.
Click below if the download didn't start automatically.