Table of Contents
What Are Cold Email Benchmarks and Why Do They Matter?
Overall Cold Email Benchmarks for B2B in 2026
Cold Email Open Rate Benchmarks by Industry
B2B Cold Email Reply Rate Benchmarks by Industry
Cold Email Meeting Booked Rate Benchmarks
Cold Email Campaign Performance Benchmarks: What Good Looks Like End-to-End
Key Factors That Move Cold Email Benchmarks
Common Cold Email Benchmark Mistakes B2B Teams Make
How Cleverly Runs Cold Email Campaigns That Beat Industry Benchmarks
Conclusion
Frequently Asked Questions
Modified On :
April 16, 2026
Key Takeaways
- The B2B cold email benchmark average sits at a 27.7% open rate and 3.43% reply rate in 2026 — but industry context matters far more than overall averages.
- Reply rate is a more reliable performance signal than open rate, which is significantly inflated by Apple Mail Privacy Protection.
- Legal services leads all industries with up to a 10% reply rate; SaaS and software sit at the bottom with rates often under 2%.
- Meeting booked rates range from 0.5% to 2.5% depending on deal type, offer clarity, and follow-up quality — most published benchmarks skip this metric entirely.
- Smaller, tightly targeted lists consistently outperform high-volume blasts: campaigns under 50 recipients average a 5.8% reply rate vs. 2.1% for large sends.
- Two to three follow-ups can generate up to 42% of all replies — most reps never send a second email and leave nearly half their pipeline on the table.
Many cold email teams are measuring the wrong things. They're celebrating a 40% open rate while sitting on a 1.2% reply rate — and wondering why the pipeline isn't moving.
The real problem isn't effort. It's that teams benchmark against the wrong numbers.
The platform-wide average reply rate from Instantly's 2026 Benchmark Report — analyzing billions of cold email interactions — sits at just 3.43%. But "average" without industry context is nearly useless. A 3% reply rate in legal services is a red flag. In SaaS, it's close to the norm.
Personalization also plays a massive role — emails tailored to recipients see a 32% higher response rate, while customized subject lines improve open rates by 50%.
This guide breaks down cold email benchmarks by industry — covering open rates, reply rates, meeting booked rates, and full-funnel campaign performance. This is the data you need to diagnose what's working and what isn't.
What Are Cold Email Benchmarks and Why Do They Matter?
Cold email campaign performance benchmarks are reference values for the key metrics in your outreach funnel. Think of them as a diagnostic tool, not a report card.
If you send 1,000 emails and 250 are opened, 15 reply, and 3 book meetings — each of those numbers tells you something different about where your system is breaking.
A high email open rate with a low reply rate means your subject line is working but your copy or CTA isn't. A low open rate with a high reply rate means you're reaching the right people, just not enough of them.
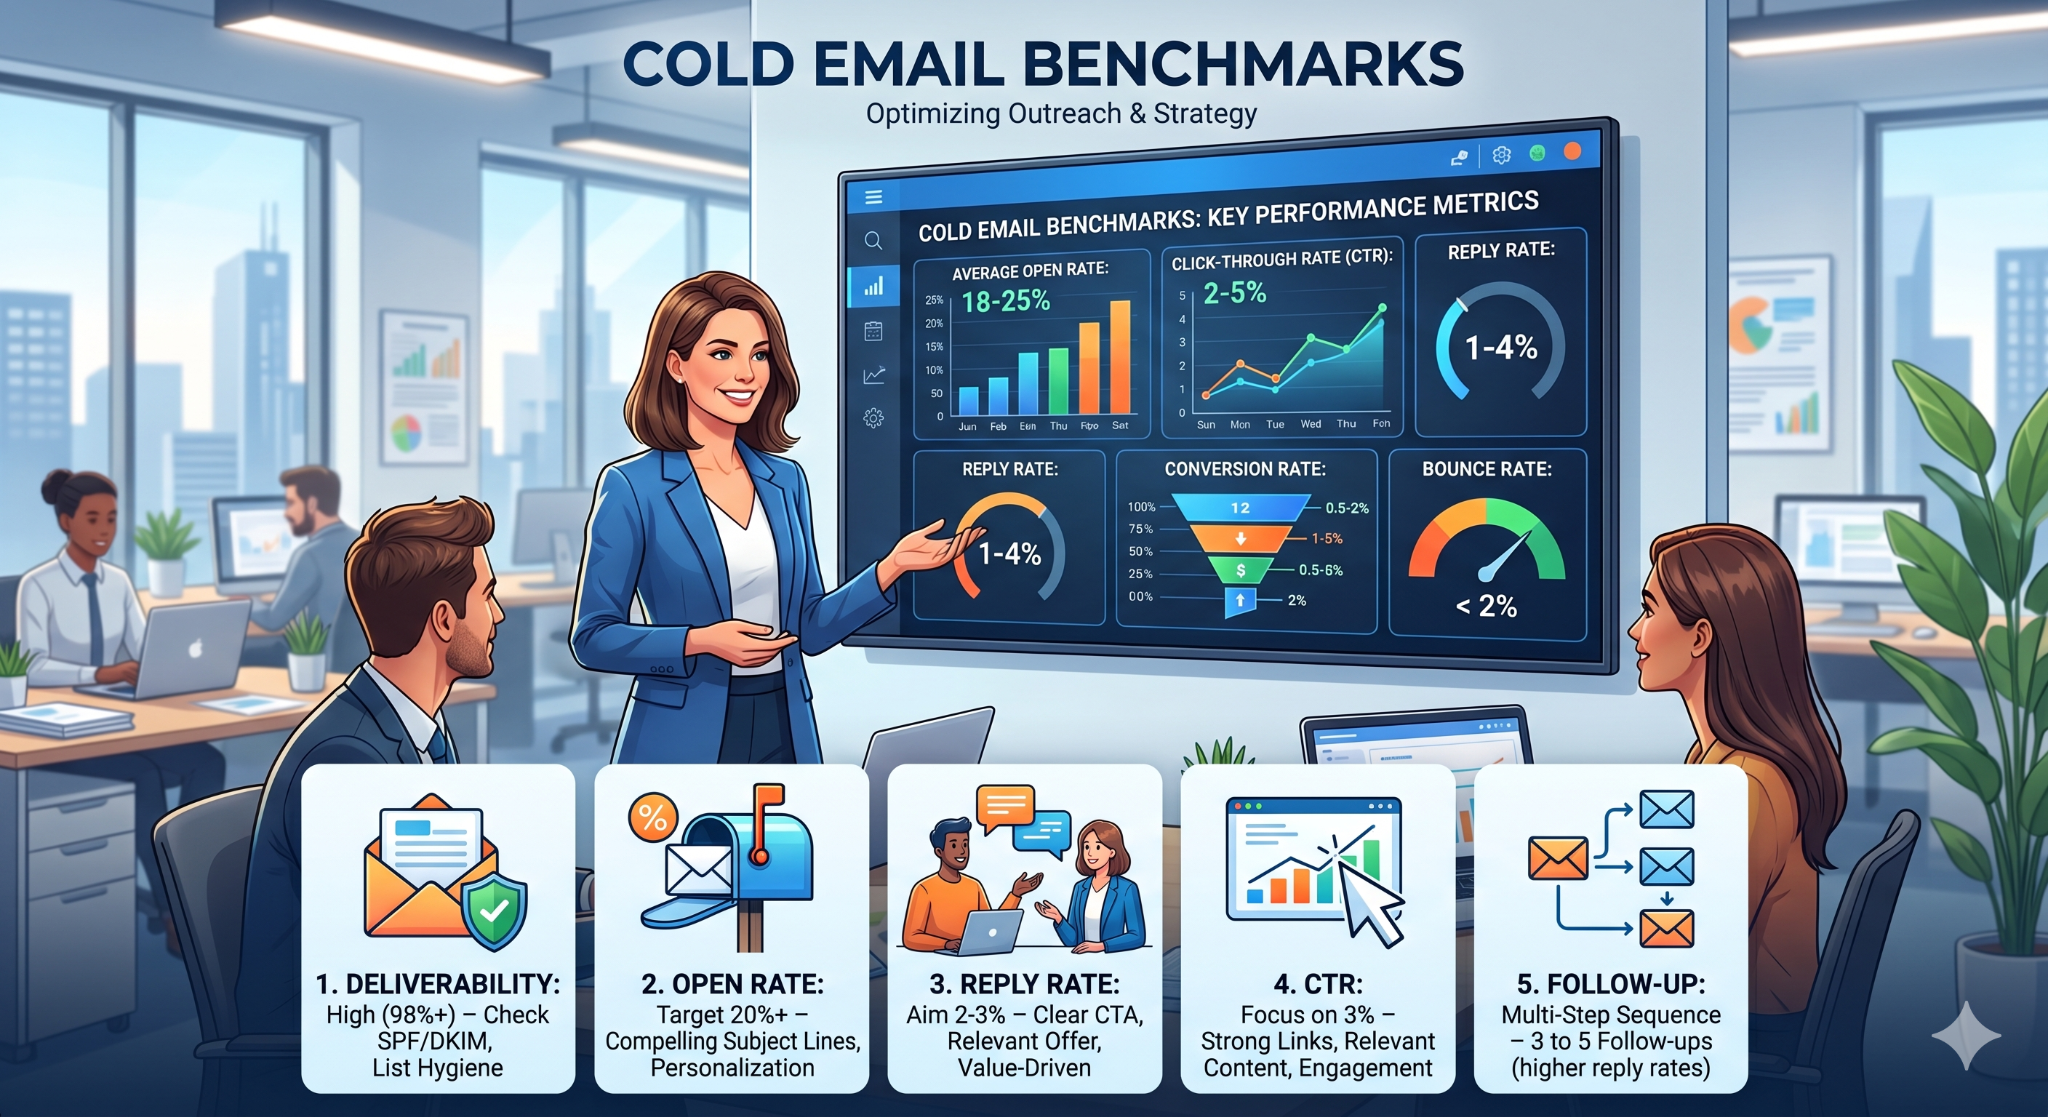
The four metrics every cold email campaign should track:
- Open rate — the percentage of delivered emails that get opened (note: partially inflated by Apple MPP)
- Reply rate — the percentage of recipients who respond (the most reliable engagement signal)
- Meeting booked rate — the percentage of emails or positive replies that convert to a scheduled call
- Bounce rate — the percentage of emails that fail to deliver (keep this under 2%)
One thing most teams get wrong: they use vanity metrics like send volume or impressions to evaluate success. Sends don't generate pipeline. Conversations do. Benchmarks only help if you're tracking the metrics that actually connect to revenue.
🚀 Your Industry Has a Benchmark. Does Your Campaign Meet It?
Don’t worry even if it doesn’t (right now). We run cold email end-to-end—targeting, copy, sending. You only pay for qualified calls we deliver.
Overall Cold Email Benchmarks for B2B in 2026
Before diving into industry-level data, here's the global baseline for B2B cold outreach in 2025–2026.
Open Rate
The average cold email open rate in 2026 is 27.7%. However, treat this number carefully. Apple Mail accounts for 49.29% of opens and preloads tracking pixels automatically, making open rate an unreliable metric in 2026. Some platforms report averages as high as 44% when MPP-inflated data is included. The point: open rate is a directional signal, not a precise performance measure.
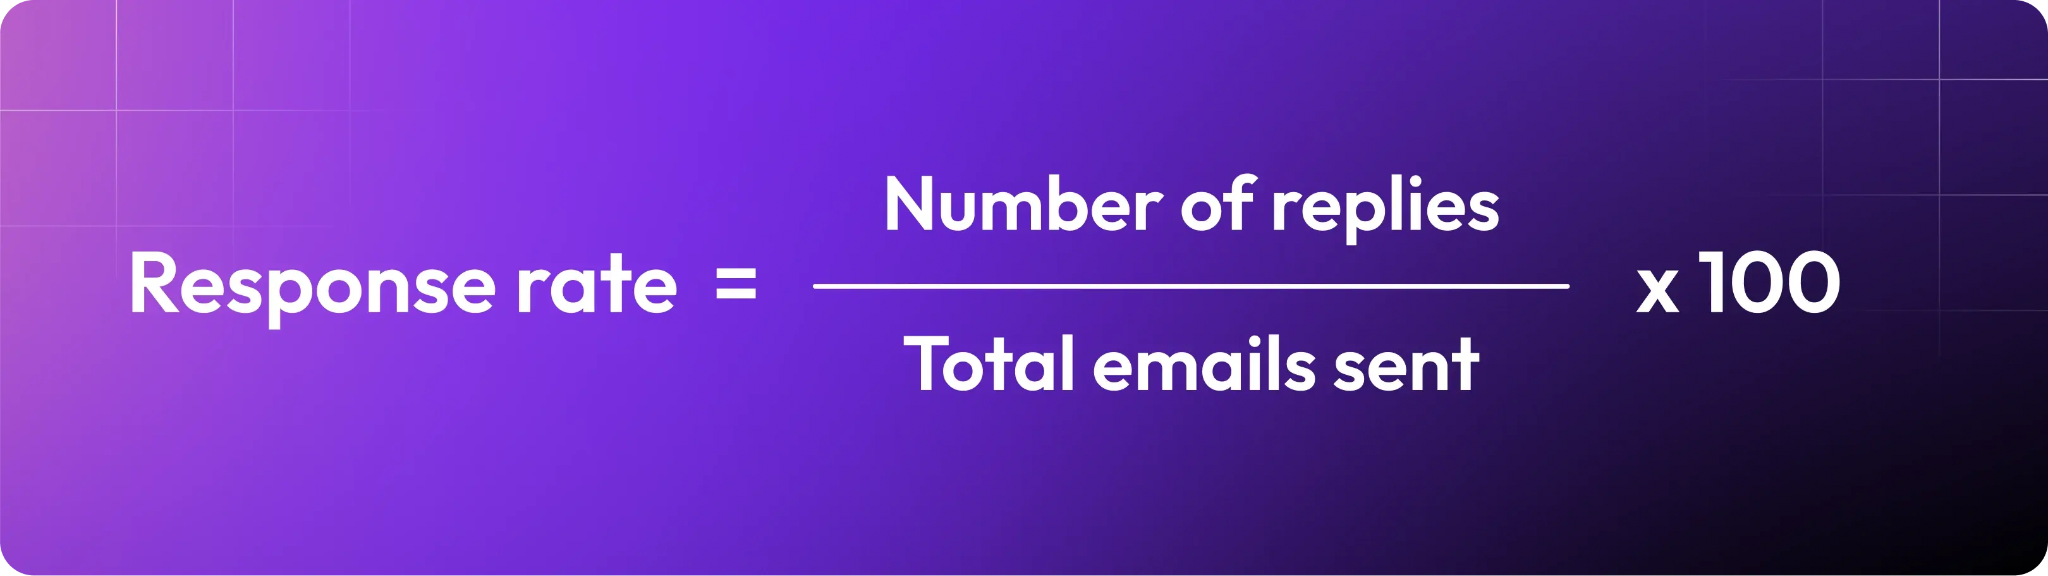
Reply Rate
The overall average reply rate is 3.43%, with top-performers exceeding 10% — two to four times higher than the platform average. A reply rate above 5% puts you ahead of most B2B senders. Hitting 10%+ is considered excellent in most industries.
Meeting Booked Rate
This is the metric most benchmarks skip — and it's the one that matters most for revenue teams. Realistically, for every 100 emails sent, you can expect 1 to 2 meetings, depending on deal type, offer clarity, and follow-up quality.
Bounce Rate and Unsubscribe Rate
Average unsubscribe rates across cold campaigns sit at 0.17%, holding steady across hook types and industries. Bounce rate should stay under 2%. Bounces above 5% will damage your sender reputation and should trigger an immediate pause
Cold Email Open Rate Benchmarks by Industry
Why Open Rates Vary — and How to Read Them
Open rates shift dramatically based on industry, audience familiarity, and subject line relevance. What counts as strong in one vertical is mediocre in another.
The biggest driver of variation? Inbox saturation. SaaS decision-makers receive 15+ cold emails a week. A legal professional might receive two. That gap shows up directly in open rate data.
In general, a good open rate for cold emails in 2026 is considered to be above 45%. Businesses operating in the software industry have the highest open rates at 47.1%, while the lowest average open rates are shown by companies in the consumer goods (19.3%) and banking (19.7%) industries.
A breakdown of cold email open rate benchmarks by industry:
Company size also matters. SMB prospects tend to open more — less email volume, more curiosity. Enterprise buyers are more selective. Plan for open rates to drop as you move upmarket, and compensate with sharper subject lines and better list segmentation.
One more thing: open rate tiers should be evaluated relative to your industry, not the global average. A 28% open rate in financial services is actually competitive. The same number in SaaS is a signal something's off with your subject line or deliverability.
🔥 3% Reply Rate Is Average. We Aim Higher.
More replies. More meetings. More pipeline—done for you. No tools, no guesswork, just results.
B2B Cold Email Reply Rate Benchmarks by Industry
Why Reply Rate Is the Metric That Actually Matters
Open rate tells you if your subject line worked. Response rate of cold email tells you if your email worked. For pipeline purposes, reply rate is the signal worth obsessing over.
There's also an important distinction between total reply rate (all responses, including "not interested") and positive reply rate (genuine interest or meeting requests). Most benchmark studies report total reply rate. When building forecasts, positive reply rate — typically 40–60% of total replies — is what translates to actual pipeline.
Industry-Level Reply Rate Data
Legal services leads with a 10% response rate, while IT services lags at 3.5%. C-level executives respond 23% more often than non-C-suite employees, with reply rates of 6.4% compared to 5.2%.
The full picture:
Campaign size also matters significantly: smaller, targeted campaigns of 50 recipients or fewer average a 5.8% response rate, compared to 2.1% for larger lists.
Personalization depth is one of the biggest levers. Campaigns with advanced personalization saw reply rates up to 18% — double the average of generic templates — yet only 5% of senders personalize every message.
Cold Email Meeting Booked Rate Benchmarks
Meeting booked rate is the B2B cold email meeting booked rate benchmark most revenue teams care about — and the one almost no published study focuses on. That's a problem, because it's the only metric directly tied to revenue.
How to Define It
Meeting booked rate can be calculated two ways:
- As a percentage of total emails sent (more conservative, more useful for forecasting)
- As a percentage of positive replies (more useful for evaluating offer and CTA strength)
Both matter. Track both.
Realistic Meeting Booked Rate Ranges by Deal Type
Timeline hooks achieve a 2.34% meeting booking rate, outperforming problem-based hooks by 3.4x — making CTA and hook type one of the highest-leverage variables in meeting conversion.
Industries with shorter sales cycles and clearer ROI framing — SMB services, EdTech, real estate — tend to book meetings at higher rates than enterprise software or healthcare, where buying committees and compliance reviews extend the evaluation window.
The gap between a reply and a booked meeting usually comes down to three things: CTA clarity, offer specificity, and follow-up speed.
A vague "would love to connect" loses to a concrete "do you have 15 minutes Thursday or Friday to walk through how we did X for a company like yours?"
Cold Email Campaign Performance Benchmarks: What Good Looks Like End-to-End
A single metric never tells the full story. Here's how to think about cold email campaign performance benchmarks across the full funnel.
The Cold Email Funnel
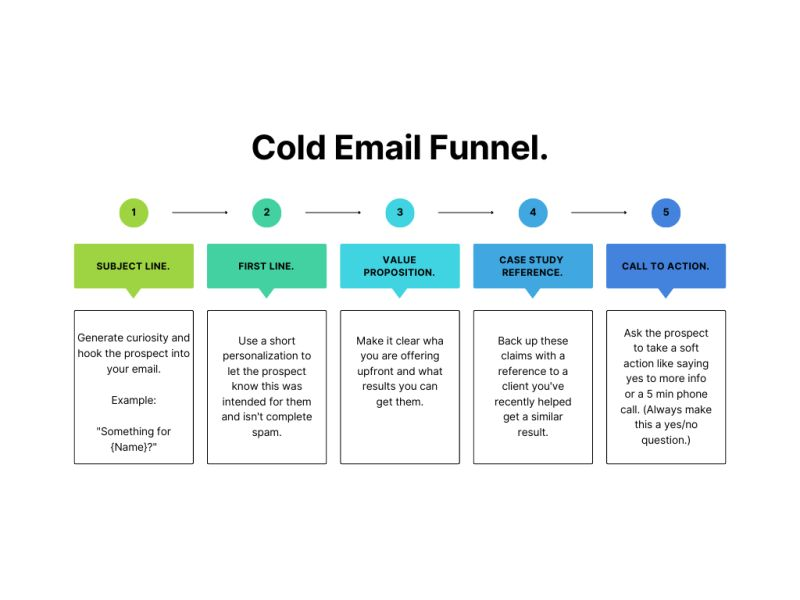
Every campaign starts with sends and ends (hopefully) with signed deals. Here's what the funnel looks like with realistic benchmark ranges:
To calculate how many emails it takes to book one meeting: if your reply rate is 5% and 40% of replies are positive, and 50% of positives book a meeting — you're converting roughly 1% of sends to meetings. That's 100 emails per meeting. With a strong ICP and tight copy, teams hit 1 meeting per 50–70 sends.
Where Most Cold Email Programs Leak
Most underperformance isn't at the send stage. It's at:
- Open → Reply: Copy that doesn't connect with the reader's actual pain
- Reply → Meeting: No follow-up system, slow responses, or weak CTAs
- Meeting → Show: No pre-meeting confirmation sequence
The sweet spot for sequence length is 4–7 touchpoints — under four gives up too early, and beyond seven diminishes returns unless each touch adds genuine new value.
Key Factors That Move Cold Email Benchmarks
Two companies in the same industry can run nearly identical campaigns and get 3x different results. Here's what drives that gap.
List Quality and ICP Accuracy
This is the biggest lever. One client increased response rates from 2% to 11% just by narrowing their ICP from "all SaaS companies" to "Series B SaaS companies using Salesforce with 50–200 employees."List quality doesn't just affect reply rate — it protects bounce rate and sender reputation, which affects every future campaign.
Subject Line Relevance
Subject lines between 6–10 words perform best, with mobile screens typically displaying 30–43 characters before cutting off. Question formats, specific value props, and pattern interrupts consistently outperform generic openers.
Email Copy Length
Messages between 50 and 125 words achieve reply rates of about 50% higher than longer formats, showing that concise, focused communication outperforms long pitches. Respect your prospect's time and they're more likely to respond.
Personalization Depth
Generic → semi-personalized → advanced personalization each represent a meaningful step up in reply rate. Highly personalized campaigns using multiple custom fields boost replies by 142% compared to generic blasts. Real personalization isn't adding {first_name} — it's referencing a specific business challenge, recent company news, or relevant trigger event.
Follow-Up Frequency
58% of all replies are generated from step one in a cold email campaign — but the remaining 42% come from follow-ups, proving follow-up persistence materially improves campaign results. Sending two to three follow-up emails starting three days after the initial message can increase response rates by up to 65.8%.
Sending Infrastructure

Cold email infrastructure — custom domains, warm-up, proper DNS authentication — directly affects inbox placement. Proper email infrastructure, including authentication and spam avoidance, can improve response rates by up to 30.5%. Good copy in a spam folder is worthless.
Offer Strength and CTA Clarity
A great email with a weak offer still doesn't convert. Specificity wins: "15 minutes Thursday to review your LinkedIn targeting" outperforms "would love to connect sometime."
Common Cold Email Benchmark Mistakes B2B Teams Make
Most teams don't fail because of effort. They fail because they're optimizing the wrong things.
❌ Benchmarking Open Rates Without Accounting for Apple MPP
Apple Mail automatically preloads tracking pixels, artificially inflating open rates for any Apple Mail user. Apple Mail accounts for 49.29% of opens, which means your open rate data includes a large chunk of false positives. Stop using open rate as a primary performance KPI.
❌ Comparing to Mass Email Marketing Averages
Email marketing benchmarks (newsletters, drip campaigns) include engaged, opted-in subscribers. Cold outreach doesn't. Comparing your cold email reply rate to a newsletter open rate is comparing apples to spreadsheets.
❌ Using Overall Averages Without Industry Context
A 3% reply rate looks bad against a 5.1% industry average. Against a SaaS-specific benchmark, it's actually competitive. Always filter your benchmark reference against your specific vertical before drawing conclusions.
❌ Ignoring Meeting Booked Rate
Most teams track opens and replies and stop there. Meeting booked rate is the only cold email benchmark directly tied to the pipeline. If you're not tracking it, you're missing the most important number.
❌ Optimizing for Volume Instead of Conversion Rate
More sends ≠ more meetings. Average cold email open rates have stabilized at 27.7% while reply rates now average 3.43%, reflecting continued inbox competition and tighter spam filtering — more volume without better targeting just generates more noise.
❌ Giving Up Before Follow-Up 2 or 3
48% of reps never send a second message, abandoning nearly half of all possible responses. Most replies don't come from the first email. If you stop after one touch, you're leaving the majority of your potential pipeline on the table.
How Cleverly Runs Cold Email Campaigns That Beat Industry Benchmarks
Most in-house cold email programs underperform benchmarks for a predictable set of reasons: the list isn't clean, the copy isn't tested, the infrastructure isn't set up properly, and there's no dedicated team managing reply handling and optimization. These aren't separate problems — they compound each other.
At Cleverly, we run cold email lead generation as a complete system, not a collection of disconnected tasks. Every campaign starts with ICP-aligned list building using multi-source verified data — which directly reduces bounce rates and protects sender reputation from day one.
Before a single email goes out, we configure dedicated sending infrastructure, including custom domains, warm-up, and DNS authentication.
Messaging at Cleverly is built around your offer and your buyer's actual pain points, not templates. We write, A/B test, and continuously refine sequences based on real reply data — the same iterative approach that separates campaigns in the top 5% from those stuck at average.
We also manage follow-up and reply handling systematically, so positive replies don't fall through the cracks between your inbox and your calendar. The result is a higher conversion rate from reply to booked meeting — the stage where most in-house teams lose pipeline without realizing it.
We've helped 10,000+ B2B companies generate $312M in pipeline and $51.2M in closed revenue across thousands of cold email campaigns. Our pay-per-performance model — month-to-month, no long-term contracts — means we're accountable to outcomes, not activity metrics.
Want cold email campaigns that are built to hit — and beat — industry benchmarks?
🔥 Book a strategy call with Cleverly!
Conclusion
Benchmarks are a starting point, not a ceiling. The best cold email teams use them to diagnose problems at specific funnel stages — not just to compare their numbers against a global average and call it a day.
Industry context matters more than any single statistic. A 4% reply rate in legal services needs work. The same number in enterprise SaaS is a decent baseline. Know your vertical, track the metrics that connect to pipeline — reply rate, meeting booked rate, positive reply rate — and fix the right lever at the right stage.
If your numbers are below benchmark, it's almost always one of four things: list quality, infrastructure, copy, or follow-up. Fix those in order and the meetings follow.
Frequently Asked Questions
Free Resource
How to Scale a Profitable Cold Call System
Get the complete guide — download it instantly now.
Free Ebook
Download the Free Guide
Enter your details to get instant access.
You're all set! 🎉
Your ebook is downloading now.
Click below if the download didn't start automatically.