Table of Contents
Why Cold Email Still Works in 2026
Key Cold Email Statistics for 2026 (Top-Line Benchmarks)
Cold Email Open Rate Statistics & Benchmarks
Cold Email Reply Rate Statistics & Benchmarks
Cold Email Conversion Rate Statistics
Cold Email Deliverability Statistics
B2B Cold Email Benchmarks by Industry
Cold Email Copy & Personalization Statistics
How Cleverly Uses Cold Email Data to Drive Qualified Meetings
Conclusion
Frequently Asked Questions
Modified On :
April 8, 2026
Key takeaways
- Average reply rate is 3.43%, but elite campaigns hit 10%+ through tight targeting and verified data.
- 58% of replies come from the first email, but 42% come from follow-ups — both matter.
- Open rates are inflated by Apple MPP; reply rate is the metric that actually tells you something.
- Bounce rates above 2% trigger deliverability penalties that hurt every future campaign.
- Personalization at scale (beyond first name) can boost replies by 142%.
- The sweet spot for sequence length is 4–7 touches with a 3-7-7 timing cadence.
- Multichannel cadences (email + LinkedIn + calls) outperform email-only by up to 287%.
Cold email statistics tell a clear story: the channel still works, but the bar is higher than it has ever been.
Inboxes are more crowded, spam filters are smarter, and buyers are more selective. Yet 61% of B2B decision-makers still prefer email as their primary outreach channel.
The problem for most teams is not the channel itself. It is benchmarking against outdated data, copying tactics from two or three years ago, and wondering why results keep slipping.
If your frame of reference is 2022 open rates or pre-MPP reply benchmarks, you are optimizing against the wrong targets.
This guide covers the most current cold email statistics 2026 available, drawn from analyses of over 100 million emails across leading outbound platforms.
You will find benchmarks for open rates, reply rates, conversion rates, deliverability, cadence performance, and copy, along with what the numbers actually mean for your outbound program.
Why Cold Email Still Works in 2026
The honest take on the state of cold email statistics 2026: the channel is not dead. It is just less forgiving of lazy execution.
A few numbers that put things in context:
- 61% of B2B decision-makers prefer email as their primary communication channel for outreach.
- Cold email delivers up to $42 ROI for every $1 spent when campaigns are tightly targeted.
- 43% of sales teams rank cold email as their most effective outbound channel.
- McKinsey research found email is nearly 40x more effective than Facebook and Twitter combined for customer acquisition.
The shift happening in 2026 is not about email losing ground. It is about volume losing ground.
AI tools have flooded inboxes with generic, AI-generated outreach. The result is that relevance, targeting precision, and deliverability infrastructure now matter far more than raw send volume.
Elite outbound teams in 2026 use AI for roughly 80% of research and sequencing work, freeing humans to focus on messaging strategy.
The question has shifted from "how many emails can we send?" to "how precisely can we target the right people with the right message at the right time?"
📧 Benchmarks Are Nice. Meetings Are Better.
Cleverly runs done-for-you cold email campaigns that send qualified prospects straight to your calendar. You only pay for meeting-ready leads.
Key Cold Email Statistics for 2026 (Top-Line Benchmarks)
Before diving into each metric in depth, here is a snapshot of where the numbers stand heading into 2026, based on analyses of billions of cold email interactions:
A few notes on methodology: Cold email open rate figures vary significantly depending on the data source because Apple Mail Privacy Protection has inflated tracking data since 2022.
Reply rate is the more reliable signal to benchmark against.
One stat worth calling out early: 58% of all replies come from the very first email in a sequence. The remaining 42% come from follow-ups. That means your opener carries the most weight, but stopping at one touch leaves nearly half your potential replies on the table.
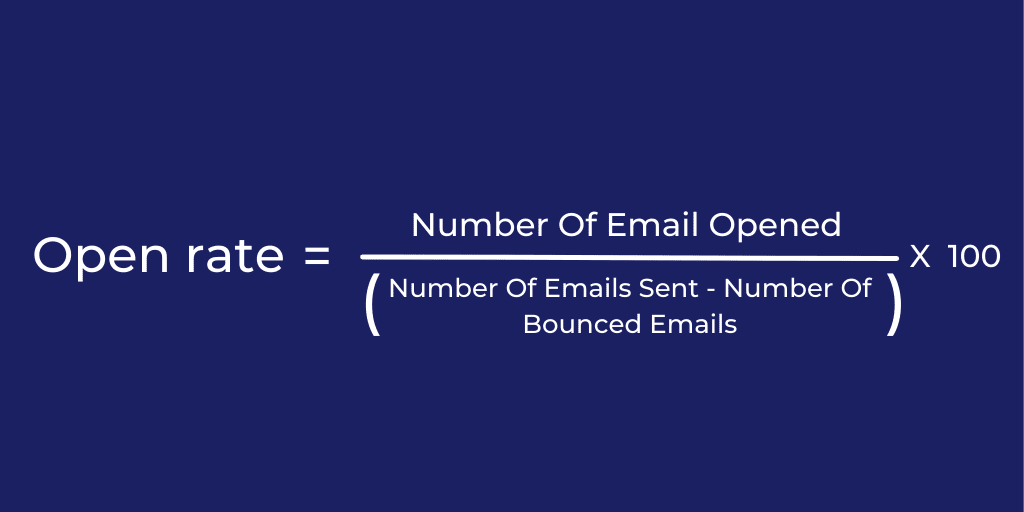
Cold Email Open Rate Statistics & Benchmarks
What is a good cold email open rate in 2026?
Open rate data is noisier than it used to be, and that is important context before you benchmark against it.
Apple Mail Privacy Protection (MPP) pre-loads tracking pixels for Apple Mail users, which means a significant portion of reported "opens" never represent a real human reading your email. Apple Mail now accounts for roughly 49% of all tracked opens, which means open rate figures are artificially inflated across the board.
With that caveat, here is where cold email marketing statistics on open rates currently stand:
- Average open rate: Sources range from 27.7% to 44%
- Good open rate: 40–60%
- Elite open rate: 65%+
📌 A good open rate to aim for in 2026 is above 45%.
What moves open rates?
- Subject line length: Subject lines of 6–10 words tend to perform best. Mobile screens typically cut off after 6–9 words, so front-load the value.
- Personalization in subject lines: Customized subject lines that include the prospect's name, company, or role improve open rates by up to 26%.
- Day and time: Multiple data sources confirm that Tuesday through Thursday, 9:30–11:30 AM in the recipient's local timezone, consistently outperforms other windows. Wednesday sees the highest reply rates overall.
Sender reputation: Open rates above 40% almost always trace back to clean deliverability infrastructure, not just great subject lines. If your open rate drops below 25% on a previously healthy domain, deliverability degradation is the likely cause.
The bottom line on open rates: Treat them as a directional signal, not a performance metric. A healthy open rate tells you emails are reaching inboxes and subject lines are working. It does not tell you whether your message is resonating. Pair open rates with reply rates to get the full picture.
🚀 Turn Outreach Into Real Pipeline
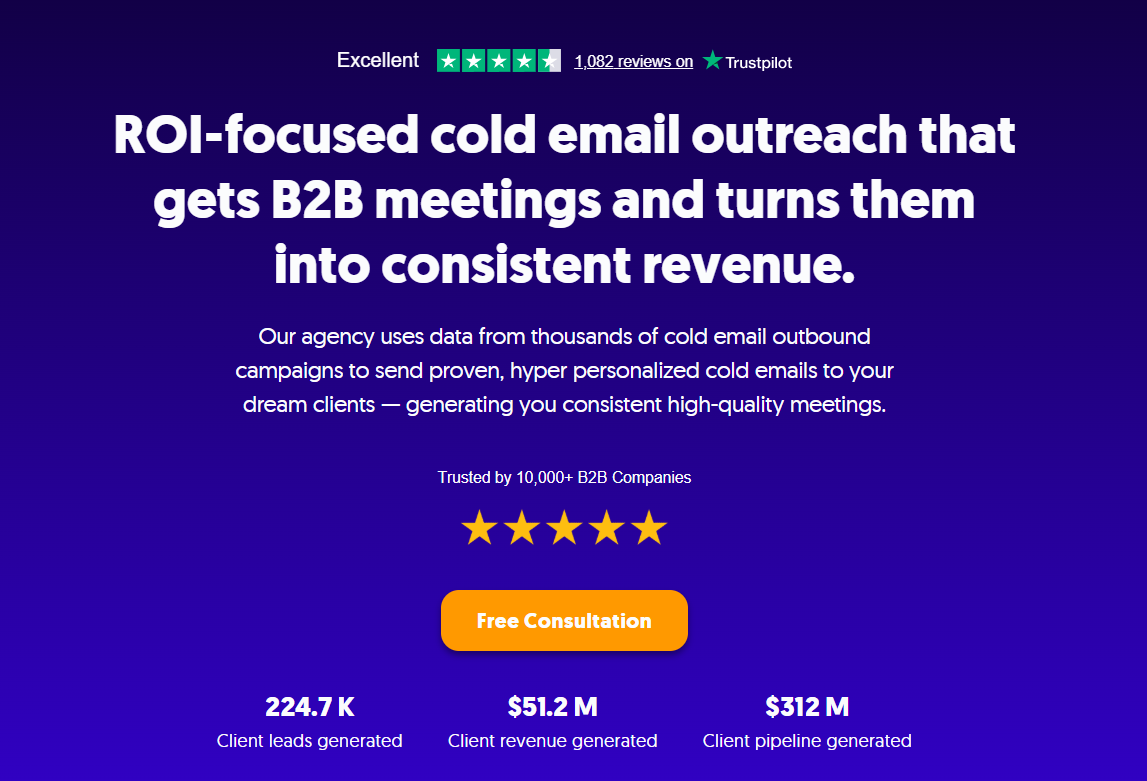
10,000+ companies use Cleverly’s LinkedIn, cold email, and cold calling systems to generate pipeline. Over $312M in pipeline created for our clients.
Cold Email Reply Rate Statistics & Benchmarks
Reply rate is the metric that actually matters for B2B cold email statistics. It is the clearest signal of message-market fit, and it is the number that connects to the pipeline.
What is a good reply rate for cold email in 2026?
- Average reply rate: 3.43%
- Good reply rate: 5–10%
- Excellent reply rate: 10–15%
- Elite performers: Exceeding 10%, with some reaching 15–25% on tightly targeted segments
Note that another large-scale study (1.37 million emails via Mailshake) put the average at 2.09%.
Different methodologies produce different numbers. The consistent pattern across all sources: relevance and targeting drive the gap between average and great.
What impacts reply rates most?
Personalization: Campaigns with advanced personalization beyond first-name merge tags see reply rates up to 18%. Generic blasts average well under 5%. Using multiple custom fields boosts replies by up to 142% compared to generic templates.
Email length: First-touch emails under 80 words consistently outperform longer emails. The sweet spot for full sequences is 50–125 words.
Single vs. multiple CTAs: Multiple CTAs dilute focus. Top performers use a single, low-friction binary question: something like "Does this make sense?" or "Worth a quick call?" Interest-based CTAs outperform calendar links by 3–5x because they reduce commitment friction.
Multichannel cadences: Email-only campaigns produce solid results. Email combined with LinkedIn and calls produces significantly better ones. Multichannel outreach using email, LinkedIn, and phone together increases response rates by up to 287% compared to single-channel efforts.
Sequence length: The sweet spot is 4–7 touchpoints. Under four and you are giving up too early. Beyond seven, returns diminish unless each touch adds genuine new value.
Reply rates by industry
A 3% reply rate might be excellent in enterprise SaaS but average for a local services campaign. Always benchmark against your vertical.
Cold Email Conversion Rate Statistics
Defining conversion in cold email
Conversion means different things depending on where you are in the funnel. The typical stages are:
- Reply (any response)
- Positive reply (expressed interest)
- Meeting booked
- Meeting held
- Qualified opportunity
- Closed deal
Each step has its own benchmark, and tracking all of them is how you pinpoint where a campaign is actually breaking down.
Cold email conversion rate statistics by stage
- Raw conversion rate (send to deal): ~ 0.2–2%, with an average around 0.7%. That equals roughly one deal per 142 emails sent for a mid-performing campaign.
- Cold outreach conversion rate range: 0.2%–2% for most B2B campaigns
- Well-targeted campaigns: 1–3% meeting booking rate per 100 emails sent
- Elite meeting booking rate: 5–8% per 100 emails sent
- Positive reply to meeting booked: Target 40–60%
What drives conversion rate more than copy?
Two factors consistently outperform everything else:
1. ICP fit: The tighter your targeting, the higher your conversion. A list of 100 highly qualified prospects will outperform a list of 5,000 loosely relevant ones every time.
2. Offer clarity: Can the recipient understand what you are offering and why it matters to them in under 10 seconds? If your email requires scrolling on mobile, it is too long.
Email length and conversion
- Under 75 words: Highest response rates for first-touch emails
- 50–125 words: Best range for overall sequence performance
- 150+ words: Meaningful drop in reply rate as emails get longer and start to read like marketing copy
One counterintuitive data point from Gong: asking for "thoughts" in a cold email increases replies but actually decreases meetings booked by 20%. The CTA that performs best asks for a low-commitment next step, not a full calendar commitment.
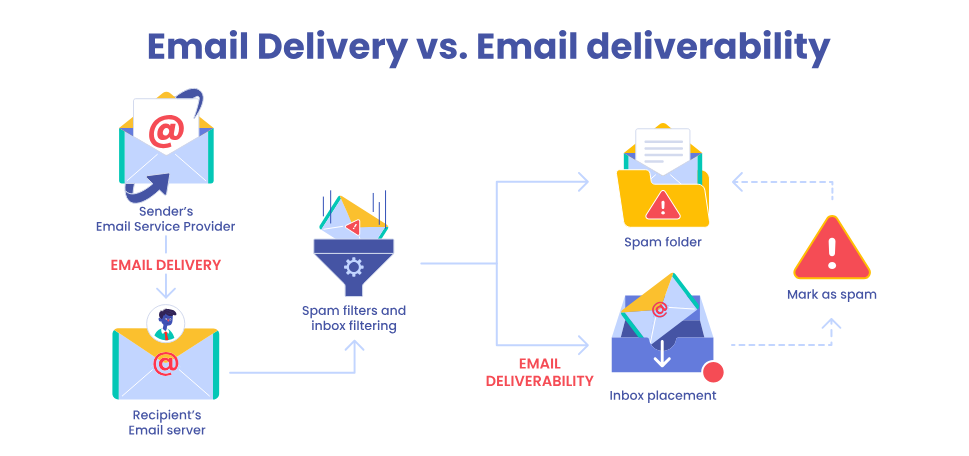
Cold Email Deliverability Statistics
Cold email deliverability is where most campaigns fail before the prospect ever reads a word. You can have the best copy in your industry, but if your emails are landing in spam, none of it matters.
The current state of inbox placement
- Global average inbox placement rate: approximately 83–84% (meaning roughly 1 in 6 legitimate emails never reaches the inbox)
- Good inbox placement: 85–90%
- Target: 90–95%+
Around 17% of cold emails never reach the inbox due to poor domain authentication, high bounce rates, or spam-triggering language.
Deliverability benchmarks to manage
- Average across all senders: 5.1% (but this includes teams with bad list hygiene)
- Safe threshold: Under 2%
- Ideal: Under 1%
📌 If bounces exceed 2%, pause sends, re-verify the list, and resume at a lower volume.
Spam complaint rate:
- Google, Yahoo, and Microsoft now enforce bulk sender rules requiring spam complaints under 0.3%.
- Gmail's internal threshold is 0.1% — exceeding this risks filtering or permanent rejection.
📌 One spam complaint damages your reputation more than ten bounces.
Domain authentication:
- SPF, DKIM, and DMARC are no longer optional. Major providers now enforce these for bulk senders.
- Missing authentication can cut deliverability by as much as 30%.
- Only about 58% of B2B email senders have properly authenticated their accounts.
Domain warmup:
- New domains need at least 2–4 weeks of gradual sending before full-volume campaigns.
- Start at 5–10 emails per day and increase over 4–6 weeks.
- Skipping warmup causes 90% of emails to hit spam immediately.
Verified lists vs. unverified:
- Verified cold email lists achieve roughly 2x the reply rate of unverified lists.
- Purchased lists perform worst: bounce rates average 18.5% and can permanently damage sender reputation.
B2B Cold Email Benchmarks by Industry
Industry context matters enormously when evaluating cold email statistics B2B benchmarks. A "good" reply rate in recruiting looks completely different from a good reply rate in financial services.
Here is how the numbers break down by vertical:
Key takeaway: What "good" looks like varies significantly by vertical and buyer type. Benchmark within your industry, not against a universal average.
Cold Email Copy & Personalization Statistics
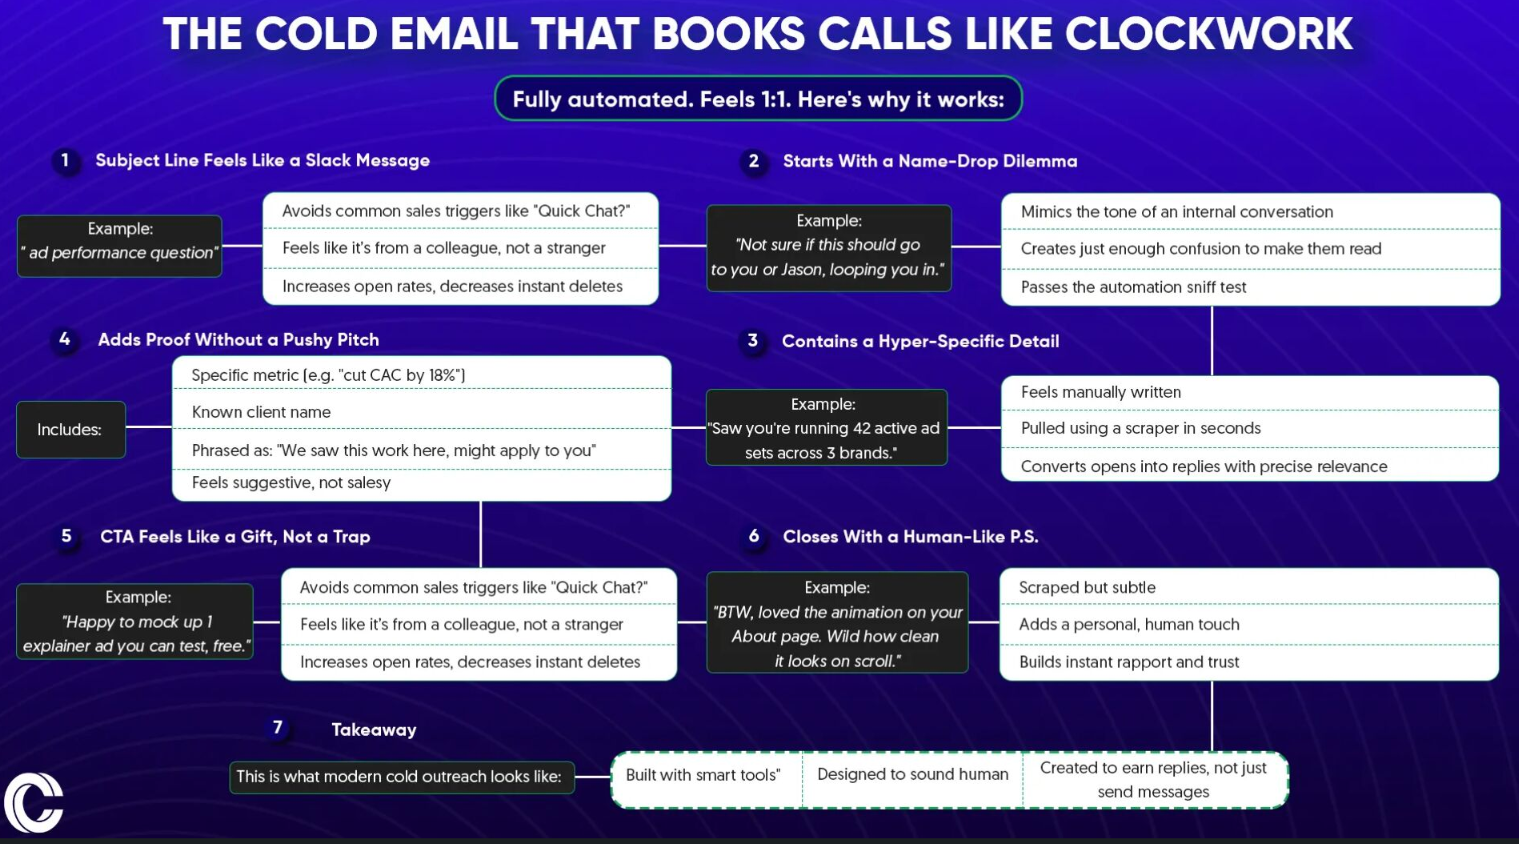
Does personalization actually move the needle?
Yes, and dramatically. Let’s see what the data says on cold email marketing statistics for copy and personalization:
- Personalized first lines outperform generic openers by a wide margin. Campaigns with advanced personalization see reply rates up to 18% vs. well under 5% for generic templates.
- Customizing subject lines with the prospect's name, company, or role improves open rates by 50%.
- Using multiple custom fields (not just first name) can boost replies by 142%.
- Only 5% of senders personalize every message they send. This is exactly why personalization still creates such a competitive edge.
AI-written vs. human-written cold email

AI tools have made it faster to produce cold email copy, but they have also flooded inboxes with generic, formulaic messages.
The result: AI-generated copy without human editing performs at or below average.
Teams using AI for research and structure while applying human judgment to messaging and positioning consistently outperform pure-AI sends.
Does video in cold email help?
The data is mixed. Video can improve reply rates in specific contexts (particularly for high-ACV deals or relationship-heavy verticals), but it also adds friction and can trigger spam filters in some environments. Test it for your audience before scaling.
Follow-up email performance
Follow-ups are not optional. They are where 42% of your replies come from. A single additional follow-up leads to 65.8% more replies according to Backlinko's study of 12 million outreach emails.
The first follow-up performs best when it feels like a natural continuation of the conversation, not a formal reminder. Phrases like "I never heard back" or "Just checking in" decrease meetings booked by 14%. Frame follow-ups as adding new value or context instead.
How Cleverly Uses Cold Email Data to Drive Qualified Meetings
Most cold email programs fail not because of the channel, but because of the system behind them. List quality is an afterthought. Domains are never warmed up. Copy is recycled from templates. Sequences are three touches and done. When results come in below benchmark, teams blame the channel instead of the process.
That is not how we do it at Cleverly.
We are a cold outreach agency trusted by 10,000+ B2B companies, and we have executed thousands of outbound campaigns across every major industry. We know what a 5% reply rate looks like in SaaS and what it looks like in manufacturing, and we build accordingly.
What working with Cleverly actually looks like:
1. Verified lead lists built for your ICP.
We build targeted, qualified email lists of your ideal decision-makers. Clean data is the foundation. Campaigns built on unverified lists bounce at 5%+ and burn domains in weeks. Ours do not.
2. Hyper-personalized copy written around your offer.
We write cold emails that get replies because they speak to real problems in the prospect's world, not generic pitches. Short, clear, with a single low-friction CTA. Under 80 words for first-touch emails. Tested and optimized continuously.
3. Full deliverability infrastructure.
SPF, DKIM, DMARC, domain warmup, inbox rotation, and spam monitoring are all handled end-to-end. Your primary domain stays protected.
4. Multi-touch sequences benchmarked against real industry data.
We run 4–7 touch cadences with proven timing and follow-up framing. You are not just getting one email. You are getting a system designed to capture the full 42% of replies that come from follow-ups.
5. You close deals, we do everything else.
When a prospect is ready to talk, you get notified. We handle list building, copy, execution, sequence management, and reply handling.
The results speak for themselves: $51.2M in client revenue generated, $312M in client pipeline, and 224.7K leads generated across our client base.
If you want cold email campaigns built and run by a team that knows what the data actually says, book a strategy call with Cleverly. You only pay for meeting-ready-leads we send you!
🔥 Get Started!
Conclusion
Cold email statistics in 2026 tell you one thing clearly: the channel works, but only when you run it like a system, not a guessing game.
Average teams are benchmarking against outdated data, sending to unverified lists, and stopping after two touches.
The teams consistently generating meetings are doing the opposite. They know their industry benchmarks, they manage deliverability like a product, and they iterate on every variable until the numbers move.
Use the benchmarks in this guide as your baseline. Then measure, test, and improve.
Frequently Asked Questions
Free Resource
How to Scale a Profitable Cold Call System
Get the complete guide — download it instantly now.
Free Ebook
Download the Free Guide
Enter your details to get instant access.
You're all set! 🎉
Your ebook is downloading now.
Click below if the download didn't start automatically.