

Table of Contents
What Is a Reverse Pipeline (Reverse Funnel) Calculation?
The Reverse Pipeline Formula
B2B Conversion Rate Benchmarks to Plug Into Your Calculator
Worked Example: Calculating Leads Needed for a $1M Revenue Goal
How to Build Your Own Lead Goal Calculator
Common Mistakes When Calculating Lead Generation Goals
How Cleverly Helps You Hit Your Lead Generation Number
Conclusion
Frequently Asked Questions
Modified On :
August 5, 2026
Key Takeaways
- Setting a lead goal by gut feel almost always leads to either wasted spend on excess volume or a pipeline that falls short of revenue targets. Working backward from revenue removes the guesswork.
- A reverse pipeline calculator only works if you plug in your own historical conversion rates. Industry benchmarks are a sanity check, not a substitute for your CRM data.
- The biggest lead volume swings come from small changes in your weakest conversion stage, usually MQL to SQL. Fix that bottleneck before you inflate your lead target.
- Build a range, not a single number. Best case, expected case, and worst case give you a defensible target that survives a bad month.
- Knowing your number is only half the job. You still need a channel that can produce that volume on a predictable monthly cadence.
Ask five sales leaders how many leads they need this quarter and you'll get five different answers, and none of them will show their math. Most teams set a lead generation target the same way they set a New Year's resolution: pick a number that sounds ambitious and hope it works out.
That approach falls apart fast once you look at the data. The cross-industry lead to MQL conversion rate averages around 31%, but it swings anywhere from the mid-20s to over 40% depending on the channel. MQL to SQL conversion sits at a median of just 13% across industries, which means most of your leads are getting lost long before a rep ever picks up the phone.
If you're setting lead targets without accounting for that drop-off, you're either overspending on volume you don't need or walking into your revenue number short.
This guide walks you through the reverse pipeline calculator formula: how to start with a revenue goal and work backward through every funnel stage to land on a real, defensible lead number.
You'll get the formula, current conversion benchmarks, a full worked example, and a framework for building your own calculator. This is for founders, sales leaders, and marketers who are done guessing.
What Is a Reverse Pipeline (Reverse Funnel) Calculation?
A reverse pipeline calculator, sometimes called a reverse sales funnel calculator, flips the usual way people think about lead generation.
Instead of generating leads and seeing what falls out the bottom of the funnel, you start with the number at the bottom (your revenue goal) and divide backward through each stage to find out how many leads you need at the top.
Why This Is the Opposite of Traditional Funnel Thinking
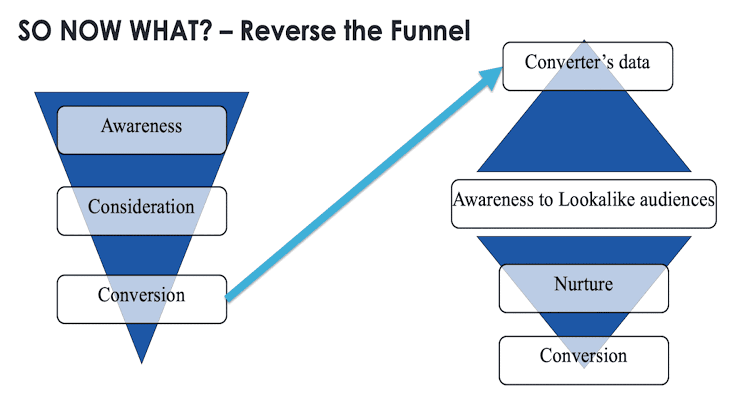
Traditional funnel thinking starts with activity: send more emails, book more meetings, add more leads. You find out at the end of the quarter whether that activity produced enough revenue.
Reverse funnel thinking starts with the outcome. You already know what you need to hit. The only question is how much raw activity gets you there.
To run the calculation, you need two inputs beyond your revenue goal:
- Average deal size (your ACV or average contract value)
- Conversion rate at each funnel stage, from raw lead down to closed-won
Why This Matters
"We need more leads" is not a plan. It's a feeling. A reverse pipeline calculation turns that feeling into a specific number your marketing and sales teams can actually be held accountable to. It also exposes exactly where your funnel is leaking, since you can't work backward without confronting your real conversion rates stage by stage.
📈 Know Your Lead Target. Then Hit It Every Month.
Our LinkedIn, cold email, and cold calling campaigns generate 15–30 qualified meetings every month to help you reach your pipeline goals.
The Reverse Pipeline Formula
Here's the full formula, broken into steps.
Step 1: Start with your revenue goal. Example: $1,000,000 in new revenue this year.
Step 2: Divide by average deal size to get deals needed. $1,000,000 ÷ $20,000 ACV = 50 deals needed.
Step 3: Divide deals needed by your win rate to get opportunities needed. Your win rate (opportunity to closed-won) tells you how many opportunities it takes to land one deal.
Step 4: Divide opportunities needed by your SQL-to-opportunity rate to get SQLs needed. This is the rate at which sales-qualified leads actually turn into real opportunities.
Step 5: Divide SQLs needed by your MQL-to-SQL rate to get qualified leads (MQLs) needed. This is usually the leakiest stage in the whole funnel, so it deserves extra scrutiny.
Step 6: Divide qualified leads needed by your lead-to-MQL rate to get total raw leads needed. This is your final number: the total volume of leads you need to generate at the very top.
The formula in one line:
Leads Needed = Deals Needed ÷ (every conversion rate multiplied together, stage by stage)
B2B Conversion Rate Benchmarks to Plug Into Your Calculator
If you don't have enough historical data yet, here are current benchmarks to use as a starting point. Treat these as a baseline, not gospel.
One important caveat: deal size changes everything. Win rates for deals under $10K sit closer to 28-35%, while deals over $100K in ACV typically close at just 12-18%. If your ACV is high, don't borrow a benchmark built for transactional deals. Use your own historical numbers whenever you have them. Benchmarks are there to fill gaps, not to override your actual funnel data.
Pro tip: Speed matters more than most teams realize. Leads followed up within the first hour convert to SQL at roughly 53%, compared to 17% for leads followed up with after 24 hours. That's nearly a 3x difference from response time alone, and it will throw off your calculator if your current follow-up process is slow.
🚀 53,000+ Meetings. $312M+ Pipeline. Predictable Growth.
See why 10,000+ businesses trust Cleverly to turn revenue targets into repeatable outbound results.
Worked Example: Calculating Leads Needed for a $1M Revenue Goal
Let's run the full calculation end to end using benchmark conversion rates.
Revenue goal: $1,000,000
Average deal size: $20,000
Deals needed: $1,000,000 ÷ $20,000 = 50 deals
Win rate: 20%
Opportunities needed: 50 ÷ 0.20 = 250 opportunities
SQL-to-opportunity rate: 40%
SQLs needed: 250 ÷ 0.40 = 625 SQLs
MQL-to-SQL rate: 15%
MQLs needed: 625 ÷ 0.15 = ~4,167 MQLs
Lead-to-MQL rate: 25%
Total leads needed: 4,167 ÷ 0.25 = ~16,668 leads
That's the number: roughly 16,700 raw leads to hit $1 million in new revenue, given those specific conversion assumptions.
Now watch what happens if you nudge just one variable. Drop the MQL-to-SQL rate from 15% to 10% (a realistic dip if lead scoring is loose), and your total lead requirement jumps to roughly 25,000, a 50% increase from a single stage getting worse.
This is exactly why generic benchmarks can send you badly off course. Small shifts in your weakest stage move the final number more than anything else in the formula.
How to Build Your Own Lead Goal Calculator
You don't need special software to build this. A spreadsheet does the job.
Step 1: Pull your own historical conversion rates from your CRM.
Look at the last 2-4 quarters for each stage: lead to MQL, MQL to SQL, SQL to opportunity, and opportunity to closed-won. Real data beats benchmarks every time.
Step 2: Build the spreadsheet backward.
Set up one row per funnel stage, starting with your revenue goal at the top and dividing down through deals, opportunities, SQLs, MQLs, and leads.
Step 3: Stress-test with three scenarios.
Run the calculation with your best-case, expected-case, and worst-case conversion rates. This gives you a target range instead of a single fragile number.
Step 4: Break the annual number into monthly and weekly targets.
A yearly lead goal is hard to manage day to day. Break it down so your team can track pace and catch problems early, not in month 11.
Step 5: Revisit the calculation every quarter.
Conversion rates shift as your messaging, ICP, and market conditions change. A calculator built once and never touched again becomes useless within two quarters.
Common Mistakes When Calculating Lead Generation Goals
❌ Using industry benchmarks instead of your own data. Benchmarks are a placeholder until you have enough historical volume, not a permanent input.
❌ Ignoring your worst bottleneck stage. Most teams apply a flat conversion rate across the whole funnel instead of isolating the stage that's actually dragging performance down, usually MQL to SQL.
❌ Setting one fixed number instead of a range. Conversion rates fluctuate month to month. A single target number breaks the first time reality doesn't match the spreadsheet.
❌ Never revisiting the calculation. Deal size, ICP, and channel mix all shift over time. A calculation from a year ago is stale.
❌ Treating the lead number as a volume target only. Hitting 16,000 leads means nothing if they're the wrong fit. Volume without qualification just moves the problem downstream.
How Cleverly Helps You Hit Your Lead Generation Number
Running the math is the easy part. The harder problem is building an engine that can actually produce that volume, month after month, without your team burning out managing five different tools.
That's the gap we close at Cleverly.
Once you know your lead number, we build and run the outbound system that hits it, combining LinkedIn outreach, cold email, and cold calling into one coordinated campaign instead of leaving you to stitch tools together in-house.
You get a dedicated team handling targeting, copywriting, deliverability infrastructure, and daily execution, so the volume shows up on schedule instead of depending on whether your SDR had a good week.
We've run this playbook across a wide range of revenue targets and deal sizes, from early-stage startups calculating their first lead goal to established teams resetting targets for a new fiscal year.
Across our client base, we've generated over $312 million in client pipeline and 224,700+ leads, which gives us a reference point for what realistic volume looks like across almost any ICP or ACV range.
If you've done the math and know your number, book a strategy call with Cleverly to talk through whether your current setup can actually hit it.
Conclusion
A reverse pipeline calculation turns "we need more leads" into a number you can defend in a board meeting. Start with your revenue goal, divide backward through your real conversion rates, and you'll land on a lead target that's grounded in math instead of optimism.
Use your own historical data whenever you have it, build a range instead of a single fixed number, and revisit the calculation every quarter as your funnel changes. And once you have the number, remember it only matters if you have a system that can reliably produce it. The calculation tells you where to aim. The execution is what gets you there.
Frequently Asked Questions
Free Resource
How to Scale a Profitable Cold Call System
Get the complete guide — download it instantly now.

Free Ebook
Download the Free Guide
Enter your details to get instant access.
You're all set! 🎉
Your ebook is downloading now.
Click below if the download didn't start automatically.


