Table of Contents
What Is Pipeline Coverage Ratio?
Why the "3x Pipeline Coverage" Rule Is Outdated
The Correct Formula for Calculating Your Pipeline Coverage Ratio
What Is a Good Pipeline Coverage Ratio by Segment?
How to Audit and Fix a Broken Pipeline Coverage Ratio
Common Mistakes Teams Make With Pipeline Coverage
How Cleverly Helps Close the Pipeline Coverage Gap
Conclusion
Frequently Asked Questions
Modified On :
August 6, 2026
Key Takeaways
- The "3x pipeline coverage" rule is a leftover from 1990s enterprise software math. It only works if your win rate happens to be around 33%, which most teams' isn't.
- Your real coverage number is 1 divided by your historical win rate, not a number you borrow from an industry blog.
- Coverage should be calculated separately for each segment, deal size, and lead source. One company-wide ratio hides where the actual gaps are.
- A high coverage ratio means nothing if the pipeline behind it is stale, unqualified, or sitting with no next step. Coverage measures value, not health.
- Fixing a coverage gap is a two-part diagnosis: figure out whether you're short on top-of-funnel volume or losing deals to bad qualification, then treat those as separate problems.
Every sales leader has said it at some point: "we need 3x pipeline coverage." It's become one of those numbers that gets repeated in QBRs without anyone checking if it actually applies to their business.
Here's why that matters right now. Only 40-55% of B2B sales reps hit quota in 2026, down from a 60-65% baseline before 2022. Global quota attainment sits around 43%, with only 28% of reps hitting 100% of their number. A lot of that gap traces back to teams setting pipeline targets using a rule of thumb instead of their own numbers.
The 3x rule creates two failure modes. Set your coverage target too low, and you miss quota with no warning, because the pipeline looked "fine" on a dashboard that was measuring the wrong thing. Set it too high, and you burn the budget generating pipeline volume you never needed, chasing a ratio that was never calibrated to how your team actually wins deals.
This guide breaks down what pipeline coverage ratio actually means, why the 3x benchmark is outdated, the correct formula to use instead, what good coverage looks like by segment, and how to fix it when the number is off.
It's built for sales leaders, RevOps, and founders who want a forecasting model based on their own data, not a number that showed up in a slide deck a decade ago.
What Is Pipeline Coverage Ratio?
Pipeline coverage ratio is the relationship between how much qualified pipeline you have and how much revenue you're trying to close in a given period.
Formula: Pipeline Coverage Ratio = Total Qualified Pipeline Value ÷ Revenue Target
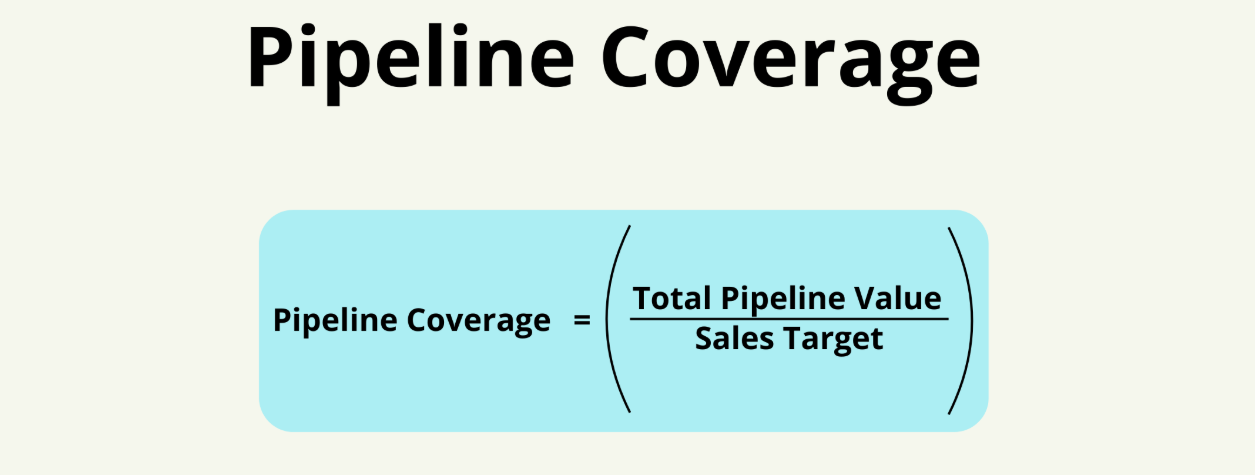
Example: If you're carrying $500,000 in qualified pipeline against a $100,000 quarterly target, your coverage ratio is 5:1. That looks healthy on paper. Whether it actually is healthy depends entirely on one thing: your win rate.
The metric only works if "qualified" actually means qualified.
This is where most coverage numbers fall apart before you even get to the formula. If your pipeline includes deals that stalled two months ago, contacts who never confirmed budget, or opportunities a rep added just to hit an activity metric, your coverage ratio is measuring noise, not revenue potential.
A pipeline coverage ratio built on an inflated pipeline will always look better than reality. That's the trap. The number gives you false confidence right up until forecast day, when a chunk of that "pipeline" simply doesn't close.
Before you calculate anything, define what counts as qualified for your team. At minimum, that usually means: confirmed budget or budget range, an identified decision-maker or buying committee, a defined next step with a date, and a real business problem your product solves.
📈 The Right Pipeline Coverage Starts With More Qualified Meetings
Our LinkedIn, cold email, and cold calling campaigns generate 15–30 qualified meetings every month to keep your pipeline full.
Why the "3x Pipeline Coverage" Rule Is Outdated
The 3x rule didn't come from nowhere. It has real origins, and those origins explain exactly why it doesn't fit most teams today.
Where the 3x benchmark came from
The number traces back to enterprise software sales in the 1990s, the Oracle and SAP era of six-figure deals, roughly 20% win rates, and nine-month sales cycles. It got passed down through sales leadership generations as a universal rule, even though it was built for one specific type of deal.
The math behind it
3x coverage assumes a win rate of roughly 33%. That's the whole logic: if you win one out of every three deals in pipeline, 3x coverage gets you to your number. The problem is simple. If your actual win rate isn't close to 33%, 3x is the wrong ratio for your business, full stop.
Why one ratio can't fit every team
SMB, mid-market, and enterprise motions have almost nothing in common when it comes to win rate and cycle length. Win rates decrease as deal size increases: under $50K deals win 25-35% of the time, deals between $50K and $250K win 18-28%, and deals over $250K land between 12-22%. Applying the same 3x multiplier across all three segments guarantees the number is wrong for at least two of them.
The current benchmark
The average B2B win rate in 2026 is 21% across all opportunities, rising to 29% when you only count opportunities that were properly qualified. Neither number is close to the 33% the 3x rule assumes. If your team is running an average B2B motion, 3x coverage is already too thin.
The Correct Formula for Calculating Your Pipeline Coverage Ratio
Once you accept that 3x is arbitrary, the fix is straightforward. You calculate coverage from your own win rate instead of someone else's.
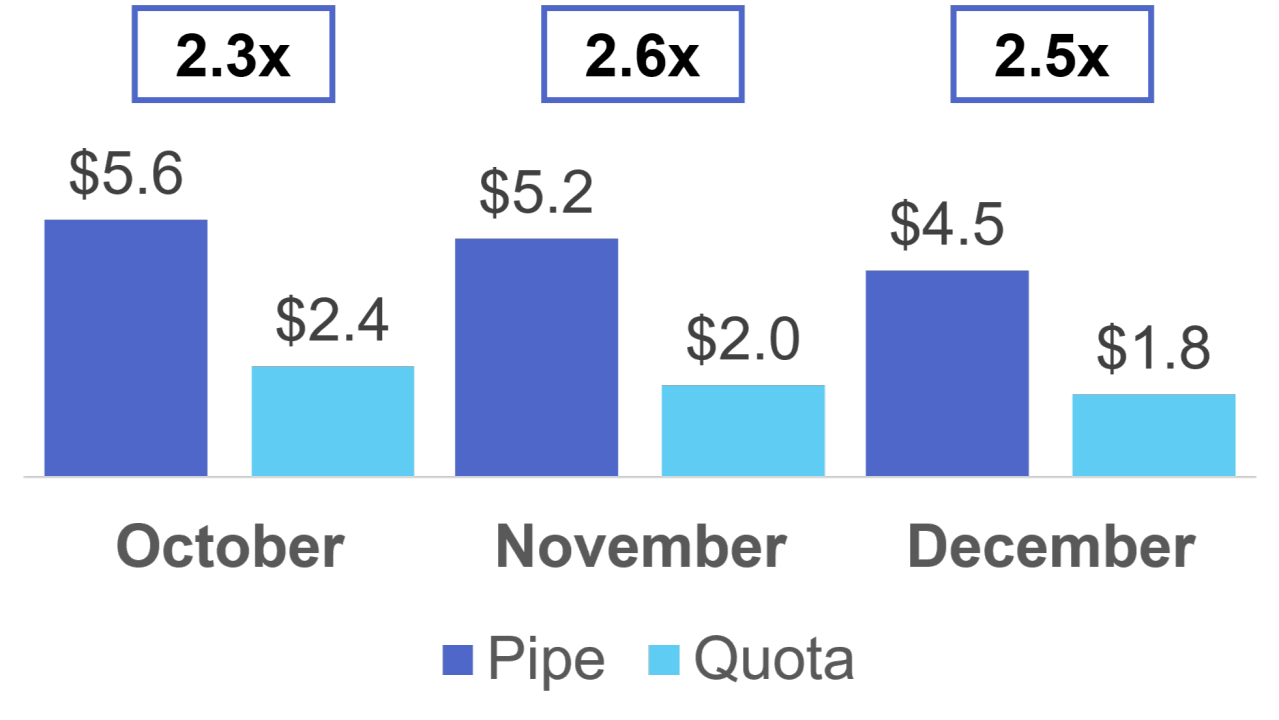
Core formula
Required Coverage Ratio = 1 ÷ Historical Win Rate
That's it. If you close 25% of qualified opportunities, you need 4x coverage to hit your number, assuming every dollar in pipeline closes exactly on schedule. It won't, which is why the next step matters.
Add a buffer for slippage
Deals push. Forecasts drift. Some percentage of "this quarter" pipeline always slides into next quarter. A 1.2x buffer on top of the base formula accounts for that reality without wildly overcorrecting.
Worked example:
- Win rate: 25%
- Base coverage: 1 ÷ 0.25 = 4x
- With buffer: 4 x 1.2 = 4.8x coverage needed
That's meaningfully higher than the 3x rule almost everyone defaults to, and it's a real number pulled from actual performance instead of a decades-old assumption.
Use your own win rate, not an industry number
Industry benchmarks are a sanity check, not an input. Pull your actual historical win rate from your CRM, segmented over at least the last two to four quarters, and use that.
Segment the calculation
Don't stop at one company-wide ratio. Calculate coverage separately by:
- Team (AE pod, geography, vertical)
- Product line (different products often have different win rates)
- Deal size tier (SMB vs. mid-market vs. enterprise inside the same org)
- Lead source (inbound, outbound, partner, expansion)
A single blended ratio hides exactly the information you need. If your enterprise segment is under-covered while SMB is over-covered, a company-wide average tells you everything is fine when it isn't.
🚀 53,000+ Meetings. $312M+ Pipeline. Predictable Growth.
Join 10,000+ businesses using Cleverly to build the pipeline coverage needed to hit revenue targets month after month.
What Is a Good Pipeline Coverage Ratio by Segment?
Coverage ratio should move in the opposite direction from win rate. Higher win rate, lower coverage needed. Lower win rate, higher coverage needed.
Mid-market SaaS deals in the $10K-$50K ACV range typically see win rates of 20-28%, with a median around 24%, which lands squarely in the 3-4x coverage range once you run the formula.
Enterprise deals above $100K often fall between 12-18%, and those larger deals now involve an average of 13 decision-makers, which is a big part of why the win rate is lower and the sales cycle is longer. PipelineGrader + 2
The takeaway: a low win rate isn't automatically a problem. It's often just the nature of complex, high-value deals with more stakeholders. The mistake is not adjusting coverage to match it. One respected calculator on this exact topic puts it plainly: most B2B teams actually need 4 to 5 times pipeline coverage to reliably hit quota once you account for slippage, lower win rates, and deal compression, not the 3x figure most teams are still anchored to.
How to Audit and Fix a Broken Pipeline Coverage Ratio
If your forecast keeps missing despite "healthy" coverage on paper, work through this in order.
Step 1: Confirm your qualification bar
Coverage numbers are meaningless if "pipeline" includes deals that never should have been counted. Pull a sample of open pipeline and check how many actually meet your qualification criteria. If it's under 70-80%, fix qualification before you touch anything else.
Step 2: Calculate your actual historical win rate, per segment
Not company-wide. Not from memory. Pull it from the CRM, broken out by the segments that matter to your business.
Step 3: Compare current coverage against 1 ÷ win rate, not against 3x
This is usually where the gap shows up. Most teams find they've been under-covered for months without knowing it, because the benchmark they were using was too low to begin with.
Step 4: Diagnose the gap
If coverage is short, figure out which of these it actually is:
- A lead generation problem — not enough qualified opportunities entering the top of the funnel.
- A qualification or conversion problem — enough volume, but too much of it doesn't convert.
These need different fixes. More top-of-funnel volume won't help if the real issue is that reps are chasing unqualified leads. More qualification discipline won't help if there simply isn't enough volume coming in.
Step 5: Rebuild the forecast with segmented ratios, and revisit quarterly
Win rates shift. New reps ramp, market conditions change, ICP evolves. A coverage target set once and never revisited will drift out of date within a couple of quarters.
Common Mistakes Teams Make With Pipeline Coverage
❌ Applying a flat 3x ratio everywhere. Same ratio across every segment, rep, and deal size, with no check against actual win rate.
❌ Counting stale or unqualified deals in the pipeline value. This artificially inflates the ratio and hides the real gap until forecast day.
❌ Never updating the target as win rates change. A ratio calculated a year ago on last year's team, last year's ICP, and last year's market doesn't reflect this year's reality.
❌ Treating coverage as a forecasting metric only. Coverage is also a planning input for lead generation. If the ratio says you're short, that's a demand generation decision, not just a spreadsheet adjustment.
❌ Ignoring sales cycle length. Coverage tells you if you have enough value in the pipeline. It doesn't tell you whether that value will actually close inside the target period. A deal sitting in month one of a nine-month cycle doesn't help this quarter's number, no matter how "qualified" it is.
How Cleverly Helps Close the Pipeline Coverage Gap
Once a team knows its real coverage target, the next problem is usually simpler to state and harder to solve: generating enough qualified pipeline to actually hit it.
That's a lead generation problem, not a spreadsheet problem, and it's the one most RevOps teams get stuck on after the math is done.
Cleverly runs done-for-you B2B lead generation across LinkedIn outreach, cold email, and cold calling, built around a specific, defined coverage gap rather than generic lead volume.
Instead of guessing how many leads "should" be enough, the campaign gets sized against the actual number a team needs to hit its ratio for a given segment or quarter.
This matters because a coverage shortfall rarely fixes itself with more effort from the same reps working the same list. It needs a scalable, predictable source of new qualified opportunities on top of what's already in motion.
Cleverly has generated $312M in pipeline and $51.2M in closed client revenue across industries and deal sizes, working with teams that had already calculated their real coverage need and just needed the volume to fill it.
If you've done the math and know your gap, book a strategy call with Cleverly and we'll walk through what it would take to close it.

Conclusion
The 3x rule was never a law of sales math. It was a number built for one type of deal, in one era, that got repeated so often it started sounding like fact. The real formula is simpler and far more useful: 1 divided by your actual win rate, with a buffer for slippage.
Calculate that ratio per segment, not as one company-wide average, and check the qualification bar behind the pipeline before you trust the number at all. Audit your win rate first. Set coverage second. Not the other way around.
Frequently Asked Questions
Free Resource
How to Scale a Profitable Cold Call System
Get the complete guide — download it instantly now.

Free Ebook
Download the Free Guide
Enter your details to get instant access.
You're all set! 🎉
Your ebook is downloading now.
Click below if the download didn't start automatically.