Table of Contents
Why LinkedIn Benchmark Data Matters for B2B Teams in 2026
LinkedIn Connection Rate Benchmarks
LinkedIn Engagement Rate Benchmarks
LinkedIn Click-Through Rate Benchmarks
LinkedIn Outreach Benchmarks for B2B Teams
LinkedIn Benchmarks by Industry
LinkedIn Profile & Page Benchmarks
What These LinkedIn Benchmarks Mean for Your Outreach Strategy
How Cleverly Uses LinkedIn Benchmarks to Drive Qualified Pipeline
Conclusion
Frequently Asked Questions
Modified On :
April 9, 2026
Key Takeaways
- A LinkedIn connection acceptance rate of 30–45% is the 2026 benchmark. Below 20% signals targeting or profile issues that need fixing before scaling volume.
- The average LinkedIn engagement rate is 3.85% for personal profiles; carousel and document posts consistently outperform all other formats at 6.6–7%.
- LinkedIn Ads CTR benchmarks at 0.44–0.65% for sponsored content, while Message Ads average ~3.2% due to direct inbox placement.
- A good LinkedIn outreach reply rate falls between 10–25%, with top performers hitting 30–50% through personalized, multi-touch sequences.
- Industry matters. Recruiting and Staffing leads all verticals in reply rates (18–25%), while SaaS and Technology sits at the bottom (4.77%) due to inbox saturation.
- LinkedIn's weekly connection limit is reputation-based, not fixed. Strong accounts can send up to 200 requests per week, while poorly performing ones can drop to just 50.
If you're running LinkedIn outreach in 2026 and relying on gut feel to measure performance, you're flying blind.
With over 1.3 billion members on the platform and AI-generated outreach flooding inboxes, the gap between "good enough" and "actually working" has never been wider. In fact, LinkedIn now drives 75–85% of all B2B social media leads — but only for teams who know how to use it well.
This guide breaks down the most up-to-date LinkedIn benchmarks across every metric that matters: connection rates, engagement rates, click-through rates, outreach reply rates, and more — broken down by format, seniority, and industry.
Whether you're an SDR, a founder, or a B2B marketer trying to build a predictable pipeline, these numbers give you the context to know where you stand and what to fix.
Why LinkedIn Benchmark Data Matters for B2B Teams in 2026
One problem most teams run into: they celebrate a 20% connection acceptance rate without realizing that's actually below average. Or they dismiss a 5% engagement rate on a post when that's genuinely excellent for most company pages.
Without LinkedIn benchmarks 2026 to compare against, your optimization efforts are just guesswork.
What makes this especially tricky is that LinkedIn has changed significantly. A few shifts worth knowing:
- LinkedIn's algorithm was completely rebuilt. In late 2024, LinkedIn replaced its content ranking system with an AI model called 360Brew, trained specifically on LinkedIn data. Content that used to go viral may no longer perform the same way. The new system rewards expertise alignment, comment quality, and dwell time over raw engagement volume.
- Connection limits are now reputation-based. LinkedIn's weekly request cap isn't a fixed number anymore — it adjusts based on your acceptance rate, SSI score, and account history. Poor performance reduces your capacity; strong performance expands it.
- AI-generated outreach is everywhere. Buyers are getting more selective, and templated messages are being tuned out faster than ever. The bar for relevance has gone up across the board.
- LinkedIn still wins for high-ticket B2B. Despite these shifts, social sellers using LinkedIn are 51% more likely to hit quota and achieve 2x higher ROI compared to traditional outreach methods.
Bottom line: Benchmarking against 2023 or 2024 data is going to steer you wrong. The numbers have moved, and strategy needs to move with them.
📈 Benchmarks Are Helpful. Pipeline Is Better.
Cleverly’s LinkedIn outreach has generated $312M in pipeline for 10,000+ companies. Plans start at just $397/mo.
LinkedIn Connection Rate Benchmarks
Your LinkedIn connection acceptance rate is the first gate in your outreach funnel. If people aren't accepting your request, they'll never see your follow-up messages.
What "good" looks like in 2026:
- Below average: Under 20–25% (this is a red flag — LinkedIn may reduce your weekly sending capacity)
- Average: 25–35%
- Strong: 35–45%
- Top performer: 45%+ (typically achieved with warm, intent-triggered outreach)
A real-world study of 16,492 LinkedIn connection requests found an average acceptance rate of 37%, confirming the 30–45% range as the industry baseline for healthy outreach.
What drives acceptance rate up or down:
- Personalization matters, but maybe not how you think. Adding a message to a connection request doesn't significantly change whether someone accepts — Data shows just a 26.42% acceptance for requests with a note vs. 26.37% without. However, the message dramatically affects whether they reply after accepting (9.36% reply rate with a note vs. 5.44% without).
- Profile quality is a silent variable. Prospects click your LinkedIn profile before deciding to accept. A weak headline, missing activity, or a generic summary will cost you connections regardless of how good your targeting is.
- Warm intent signals change everything. Engaging with a prospect's content before sending a request can push acceptance rates above 60%. Cold, context-free requests average just 20–30% even with solid targeting.
- Mutual connections help. Second-degree outreach with shared contacts consistently outperforms cold third-degree requests.
Connection rate by seniority level (cold outreach):
- C-Level Executives: 10–20% (time-poor, inbox-swamped)
- VP / Director: 20–30%
- Manager / Individual Contributor: 30–45%
If your overall connection rate is below 25%, start with your targeting before touching your message. Broad, unfiltered lists are the most common culprit.
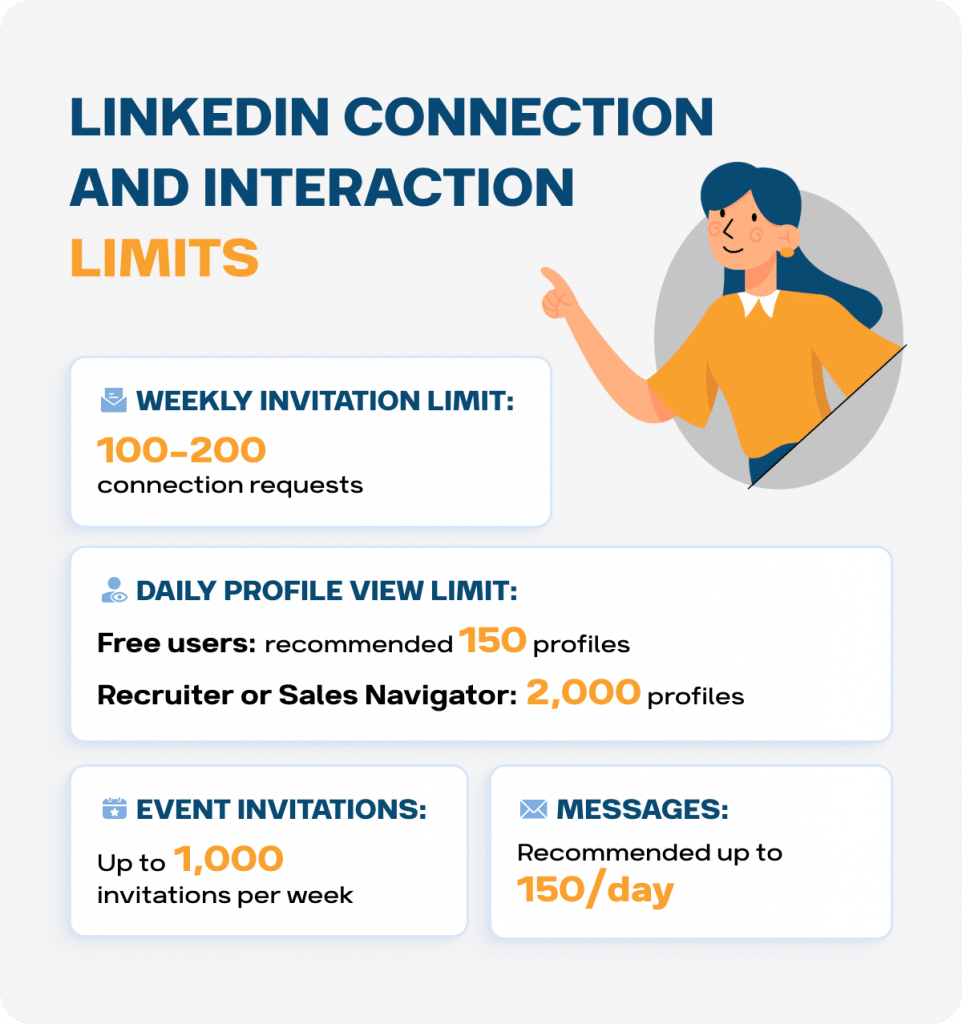
A note on LinkedIn's weekly limits in 2026:
LinkedIn's connection request limit is dynamic, not fixed. Most accounts can safely send 80–100 requests per week. High-trust accounts — those with strong SSI scores (above 65) and acceptance rates above 40% — can reach up to 200 per week.
Drop below 20% acceptance and LinkedIn can restrict your account to as few as 50 requests per week. The system rewards relevance and punishes volume for its own sake.
LinkedIn Engagement Rate Benchmarks
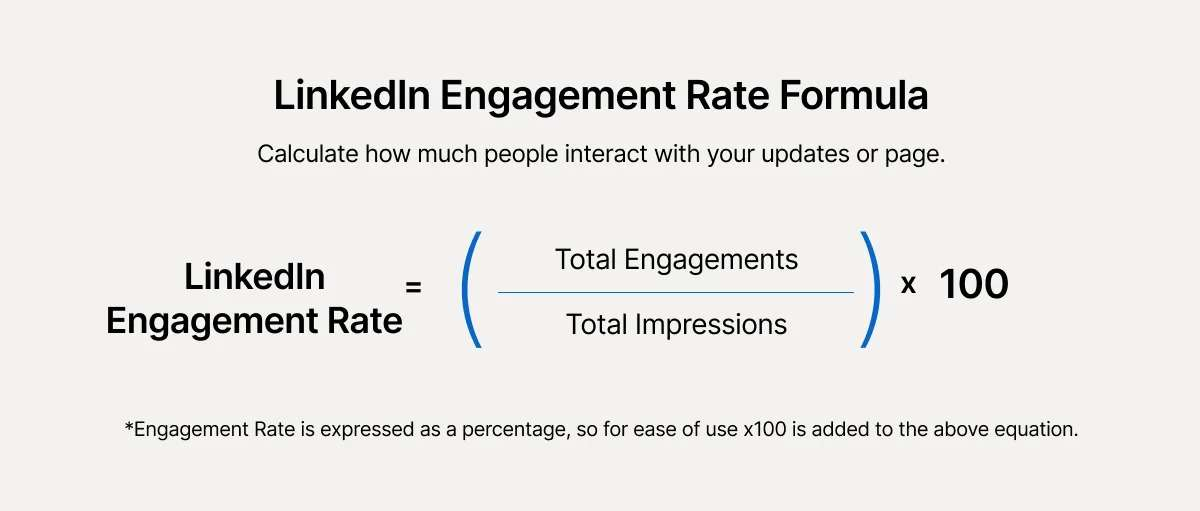
How LinkedIn engagement rate is calculated:
(Total Engagements ÷ Impressions) × 100
Total engagements include reactions, comments, shares, clicks, and saves.
Average LinkedIn engagement rate benchmark in 2026:
- Personal profiles: 3.85% (up from 3.2% in 2024, a 44% year-over-year increase)
- Company pages: 2.1% (significantly lower because LinkedIn's algorithm prioritizes human-to-human interaction over brand broadcasts)
What strong looks like:
- 4–6%: Good — you're above the platform average
- 6–10%: Excellent — top 25% of creators
- 10%+: Exceptional — top 5%
LinkedIn engagement rate benchmark by content format:
A few things stand out here. Carousels lead the pack because they drive multiple swipe interactions, which signals high engagement to LinkedIn's algorithm.
Native video performs strongly, but only when uploaded directly — YouTube links are suppressed by the platform.
Text-only posts can still punch above their weight, but the quality of the opening hook makes or breaks them.
External links continue to get penalized. If you need to share a URL, place it in the first comment rather than the post body.
Engagement rate by follower count:
- 1,000–5,000 followers: 4.2% average
- 50,000+ followers: 1.8% average
This "engagement cliff" is expected. As your audience grows, average relevance decreases. A smaller, targeted audience will almost always outperform a large, scattered one on a per-impression basis.
Common mistakes that tank LinkedIn engagement:
- Including external links in the post body
- Posting only product or promotional content
- Inconsistent cadence (companies posting weekly get 2x the engagement of monthly posters)
- Generic commentary that doesn't take a clear position
- Posting from the LinkedIn company page only and ignoring personal profiles
🚀 Turn LinkedIn Into Your Top Lead Source
Reach buyers at Amazon, Google, Uber, PayPal & more through Cleverly’s done-for-you LinkedIn outreach. We handle prospecting, messaging, and booking calls.
LinkedIn Click-Through Rate Benchmarks
CTR on LinkedIn means different things depending on what you're measuring. Let's break it down by context.
LinkedIn Ads CTR Benchmarks (2026)
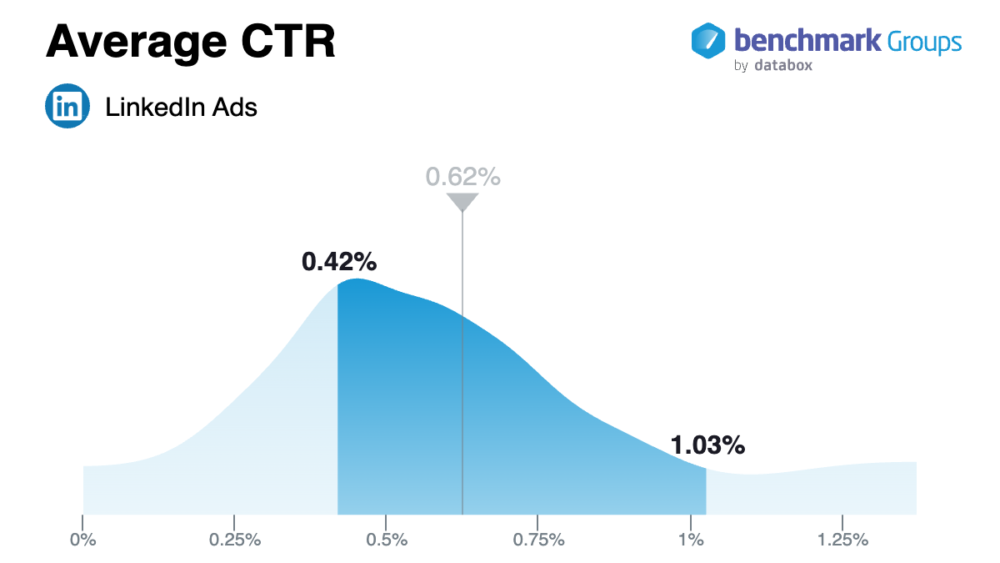
The LinkedIn click-through rate benchmark for sponsored content is 0.44–0.65% globally. This is lower than platforms like Facebook or TikTok, but that comparison is misleading — LinkedIn's audience is much more targeted, and the intent behind a click is fundamentally different in a B2B context.
CTR by ad format:
What counts as strong:
- 0.5%+: On track
- 1.0%+: Top-tier performance for most B2B campaigns
- Anything below 0.3%: Time to revisit creative or targeting
Message Ads stand out here because they land directly in a prospect's inbox with no spam filters. The 3%+ CTR reflects that direct placement advantage — but conversion depends heavily on relevance.
Organic post CTR:
For organic LinkedIn content, a good CTR on links included in posts is 3–5% of impressions. But since LinkedIn actively suppresses external links, most top-performing teams keep the link in the first comment and focus the post itself on driving engagement that feeds the algorithm. The click happens; it's just one step removed.
LinkedIn Outreach Benchmarks for B2B Teams
Beyond connection rate, there are three numbers that actually tell you whether your LinkedIn B2B benchmarks are translating into pipeline:
- Reply rate — Are people responding?
- Positive reply rate — Are the responses worth having?
- Meeting conversion rate — Are conversations turning into calendar invites?
Reply rate benchmarks in 2026:
- Below average: Under 10%
- Average: 10–25%
- Strong: 25–35%
- Top performer: 35–50%
One caveat: These numbers vary based on the type of outreach. Direct messages to first-degree connections perform at 25–35% with personalization. Cold InMail benchmarks in at 10–25% on average, with high performers hitting 30–40%. Automated sequences without personalization average closer to 10%.
InMail benchmarks specifically:
- Open rate: 57.5% average (up to 85% for highly targeted sends)
- Reply rate: 10–25% average; 30–40% for top performers
- This makes InMail 2.6–5x more effective than cold email for generating replies
What moves reply rate in the right direction:
- Adding a personalized message to your connection request lifts post-acceptance reply rates from 5.44% to 9.36%.
- Combining profile visits with a direct message can push reply rates to 11.87%.
- Outreach tied to a recent trigger event (a promotion, webinar, post engagement) boosts response rates by 32%.
- Sequenced follow-ups spaced 2–5 business days apart improve conversions by 49% over one-off messages.
- Most replies come from follow-ups, not the first message — but 48% of reps never send a second.
How many touches before a reply?
On average, it takes 5 touchpoints to convert a LinkedIn prospect into a conversation. Two to three follow-up messages spaced over one to two weeks is the practical minimum for a well-run sequence.
Reply rate by message type:
- Value-led (sharing insight, resource, or relevant data): Highest reply rates
- Question-based (open-ended, opinion-inviting): Strong, especially for C-suite
- Direct ask (pitch in the first message): Lowest reply rates — and the most common mistake
Does pairing LinkedIn with cold email help?
Yes. Omnichannel sequences combining LinkedIn, cold email, and phone outperform single-channel approaches by over 287%. LinkedIn acts as "air cover" that makes your email or call feel familiar rather than cold.
LinkedIn Benchmarks by Industry
Averages are useful. But LinkedIn benchmarks by industry tell you what you actually need to know for your market.
Here's a breakdown of approximate benchmarks by vertical:
A few things worth pointing out:
1. Recruiting and Staffing consistently outperforms every other vertical on both engagement and reply rate. LinkedIn is essentially their primary work platform, so professionals in this space are inherently more active and receptive.
2. SaaS and Technology has the lowest reply rates despite being one of the most active industries on the platform. The reason: tech professionals are drowning in automated outreach and have developed template blindness. If you're selling into SaaS, hyper-personalization that references specific product features, blog posts, or technical context is the only thing that breaks through.
3. Financial Services and Professional Services respond well when trust-building content leads the conversation. Thought leadership, data, and specific insights outperform generic pitches by a wide margin in these verticals.
4. Manufacturing and Logistics are less saturated, which means even average outreach performs better — but the audience is also less active on the platform overall. Connection rates tend to be decent; follow-through takes longer.
LinkedIn Profile & Page Benchmarks
Your outreach results are heavily influenced by the profile behind the request. Here's what the data shows:
Profile view-to-connection rate: Well-optimized outreach profiles convert profile views at roughly 30–40% when the headline and banner clearly communicate value.
Average impressions per post by follower count:
- Under 1,000 followers: 200–500 impressions per post
- 1,000–10,000 followers: 500–5,000 impressions per post
- 10,000+ followers: 5,000–50,000+ impressions per post (with strong engagement)
Company page follower growth rate: Pages that post at least once per week grow 7x faster than those that post monthly. Posting two to three times per week doubles engagement compared to weekly-only posting.
Profile elements that directly impact outreach performance:
- Headline: This is the most important real estate on your profile. Write it for your buyer, not for your resume. "Helping B2B teams book more qualified meetings" converts better than "Senior Account Executive at [Company]."
- Banner image: Often ignored, but it's visible every time someone views your profile. A clear, professional banner that reinforces your value proposition adds credibility.
- Featured section: Social proof here (case studies, media mentions, testimonials) does real work in converting profile views into connection accepts.
- Recommendations: Three to five solid recommendations noticeably increase trust with cold prospects.
- Activity / recent posts: Prospects check whether you're active before accepting a request. A dead profile hurts your acceptance rate even when targeting and messaging are solid.
Personal profiles consistently outperform company pages in organic reach. If your team is only posting from the brand page, you're missing your highest-reach distribution channel.
What These LinkedIn Benchmarks Mean for Your Outreach Strategy
Benchmarks aren't a scorecard — they're a diagnostic tool. Here's how to use them to actually improve.
If your connection rate is below 25%
Start with targeting, not messaging. Broad lists produce low acceptance rates. Tighten your ICP filters by job title, seniority, company size, industry, and geography. Once targeting is locked, check your profile — if it doesn't immediately communicate who you help and how, you're losing acceptances before your message is ever read.
If your engagement rate is below 3.85%
Look at your content mix first. If most of your posts are text-only or include external links in the body, you're being suppressed algorithmically before the quality even matters. Shift toward carousels and native video, write openers that take a clear position, and reply to every comment within the first hour. The early engagement window is when LinkedIn decides how far to distribute your post.
If your reply rate is below 15%
The most common issue is relevance, not volume. Generic messages that lead with your offer get ignored. Messages that reference something specific to the prospect — a recent post, a company announcement, a shared connection — outperform templates by a wide margin. Also check your CTA: asking for a 30-minute call in a first message is still one of the most reliable ways to kill a reply. A low-friction ask ("worth a quick chat?") performs better.
Building a LinkedIn performance review cadence:
Track these metrics weekly:
- Connection acceptance rate (by campaign or list segment)
- Reply rate (broken out by message type and sequence step)
- Positive reply rate
- Meeting conversion rate
If each of these improves by just a few percentage points, the compounding effect on pipeline output is significant. A 10% lift in connection rate, a 10% lift in reply rate, and a 10% lift in meeting conversion doesn't produce 10% more pipeline — it multiplies across each stage and can produce 30–40% more qualified conversations from the same volume.
How Cleverly Uses LinkedIn Benchmarks to Drive Qualified Pipeline
Knowing the benchmarks is one thing. Building an outreach system that consistently hits the top of those ranges is another.
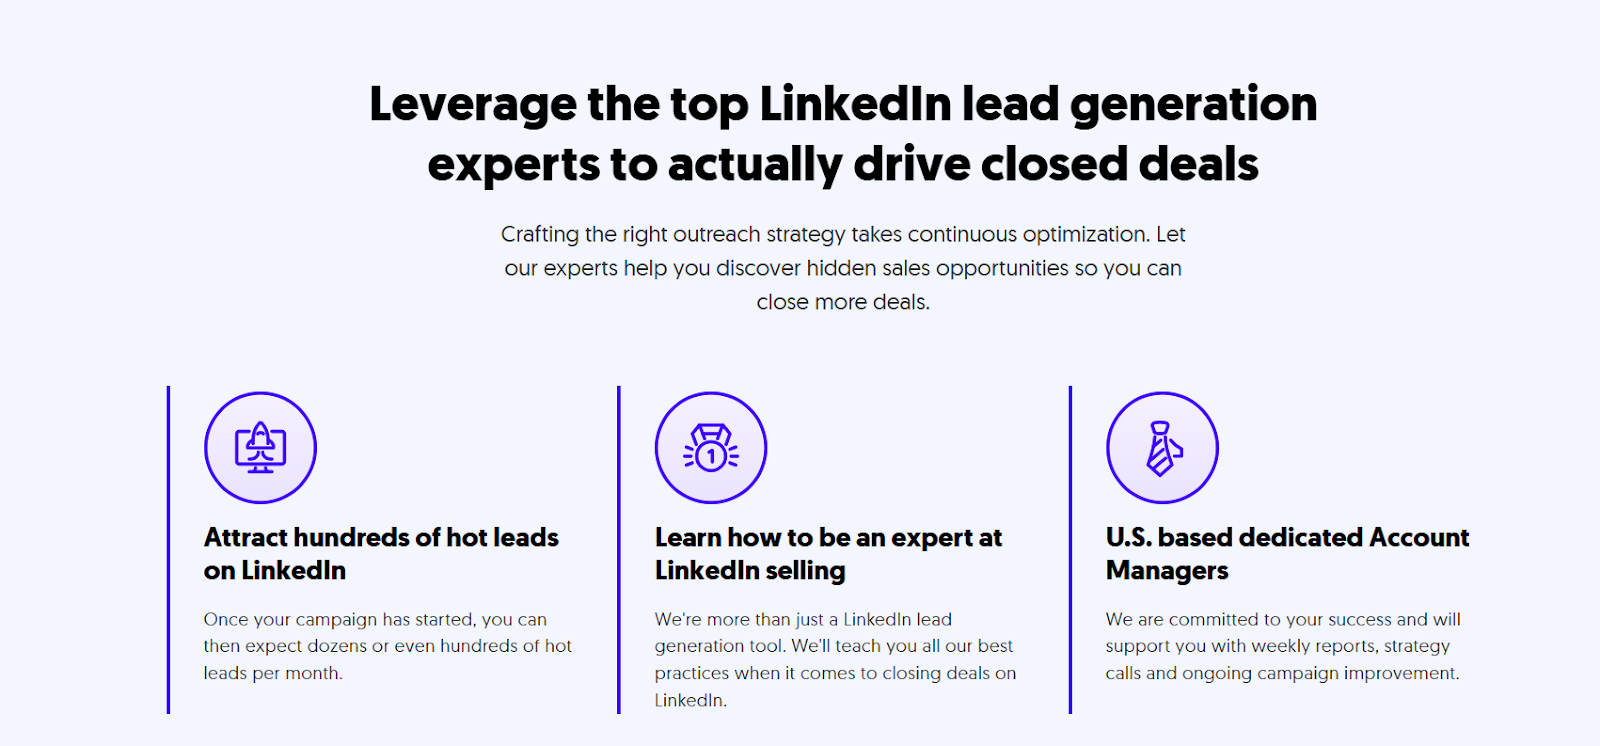
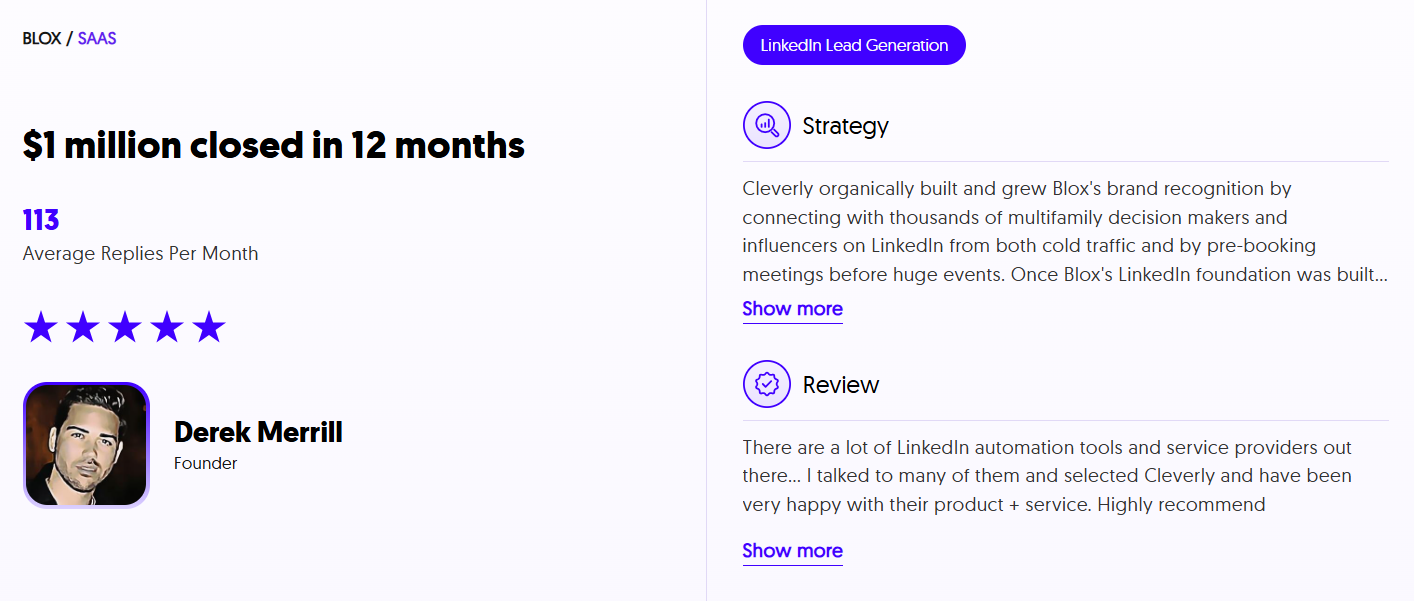
At Cleverly, we don't just know what good looks like on LinkedIn — we engineer campaigns to reach it. We're the #1 LinkedIn lead generation agency, and we've helped 10,000+ clients generate qualified pipeline with companies like Amazon, Google, Uber, PayPal, Slack, and Spotify.
…That's resulted in $312M in pipeline revenue and $51.2M in closed revenue through LinkedIn outreach alone.
What we actually do when we build LinkedIn outreach services for a client:
- ICP-based targeting so every connection request goes to someone who fits your ideal buyer profile — not a broad list that tanks your acceptance rate.
- Profile optimization that converts profile views into accepted connections and builds instant credibility with cold prospects.
- Personalized message sequences built around what actually drives replies — value-led openers, low-friction CTAs, and strategically timed follow-ups.
- Dedicated response handlers who manage your inbox, nurture warm leads, and book meetings directly on your calendar — saving you dozens of hours a month.
- Continuous optimization based on live connection rate, reply rate, and meeting rate data — not set-it-and-forget-it campaigns.
Every program we build is benchmarked against real performance data from thousands of outbound campaigns. We know what works in your industry, at your ICP's seniority level, and with your offer — because we've tested it at scale.
And we don't measure success in impressions or followers. We measure it in qualified conversations and booked meetings.
LinkedIn outreach services start at just $397/month.
Want LinkedIn outreach built and managed by a team that knows what the benchmarks actually demand?
🔥 Book a strategy call!
Conclusion
LinkedIn in 2026 rewards teams that are precise, consistent, and relevant — not teams that just send more.
The benchmarks in this guide give you the context to stop guessing and start measuring. Know your numbers, compare them against the data here, and you'll know exactly what to fix next.
Frequently Asked Questions
Free Resource
How to Scale a Profitable Cold Call System
Get the complete guide — download it instantly now.
Free Ebook
Download the Free Guide
Enter your details to get instant access.
You're all set! 🎉
Your ebook is downloading now.
Click below if the download didn't start automatically.