Table of Contents
What Is Churn Rate?
Why Churn Rate Matters for Business Growth
How to Calculate Churn Rate
Customer Churn Rate Formula
How to Calculate Monthly Churn Rate
Churn Rate vs. Retention Rate
Churn Rate Examples
What Is a Good Churn Rate?
Types of Churn Businesses Track
Common Causes of High Churn
How Customer Acquisition and Churn Are Connected
How Cleverly Helps Companies Acquire Better-Fit Customers
Conclusion
Frequently Asked Questions
Modified On :
August 12, 2026
Key Takeaways
- Churn rate measures the percentage of customers who stop using your product or service over a set time period.
- Use the formula (customers lost ÷ customers at start) × 100 to calculate churn rate quickly and consistently.
- High churn increases customer acquisition costs and reduces customer lifetime value, making growth harder.
- SaaS companies should aim for monthly churn below 2% as they scale toward maturity.
- Churn isn't just a retention problem — acquiring the wrong customers from the start is often the root cause.
- Tracking revenue churn alongside customer churn gives you a fuller picture of how attrition is actually impacting your business.
Churn rate is the percentage of customers who stop doing business with a company during a defined period. The basic formula is customers lost divided by customers at the start of the period, multiplied by 100.
If a business begins the month with 1,000 customers and loses 40, its monthly customer churn rate is 4%. That number becomes more useful when the company also measures the revenue lost, identifies which customer segments left, and compares churn by acquisition source and cohort.
This guide explains customer churn, monthly churn, gross and net revenue churn, retention, negative revenue churn, and the calculation mistakes that can distort each metric. It also shows why customer fit during acquisition matters, without treating acquisition as the only cause of retention problems.
What Is Churn Rate? Definition and Formula
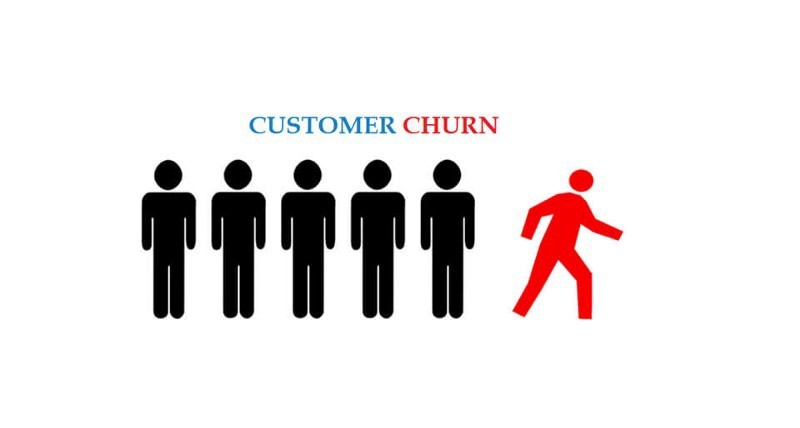
Customer churn rate is the percentage of customers who stop doing business with you during a specific time period. It's also called the customer attrition rate.
If you start a month with 500 customers and end with 470, you lost 30. That's your churn.
It's most commonly tracked by:
- SaaS companies managing subscriptions
- Subscription-based businesses like streaming or software platforms
- Telecom and digital platforms with recurring billing models
The higher your churn, the harder it is to grow. Simple as that.
The basic customer churn rate formula is:
Customer churn rate = customers lost during the period ÷ customers at the start of the period × 100
If a company starts the month with 1,000 customers and loses 40, its monthly customer churn rate is:
40 ÷ 1,000 × 100 = 4%
State the period whenever you report churn. “A 4% churn rate” is incomplete because 4% monthly churn and 4% annual churn describe very different retention outcomes.
Also state what counts as a churned customer. For example, decide whether churn occurs on the cancellation date, at the end of the paid term, after nonpayment, or after a period of inactivity. Apply the same definition every reporting period.
Read More: 5 Ps of Marketing Explained
🚀 Better Leads = Better Retention
10,000+ companies use Cleverly to bring in qualified buyers across LinkedIn, email, and phone - fueling predictable pipeline growth.
Why Churn Rate Matters for Business Growth
Churn rate analysis is not just a retention exercise. It directly impacts your revenue, profitability, and how investors see your business.
Why it matters:
- Retention drives long-term profitability. It costs far less to keep a customer than to replace one.
- High churn inflates CAC. If customers leave quickly, your customer acquisition cost (CAC) never gets fully recovered.
- Churn destroys LTV. Every churned customer reduces your customer lifetime value (CLV) and the revenue you can project.
- Predictable revenue depends on retention. Recurring revenue only stays stable when customers stick around.
- Investors watch churn closely. For SaaS and subscription businesses, churn is one of the first metrics on any due diligence checklist.
Low churn means your product works, your customers are happy, and your growth is compounding. High churn means you're running on a treadmill.
How to Calculate Churn Rate
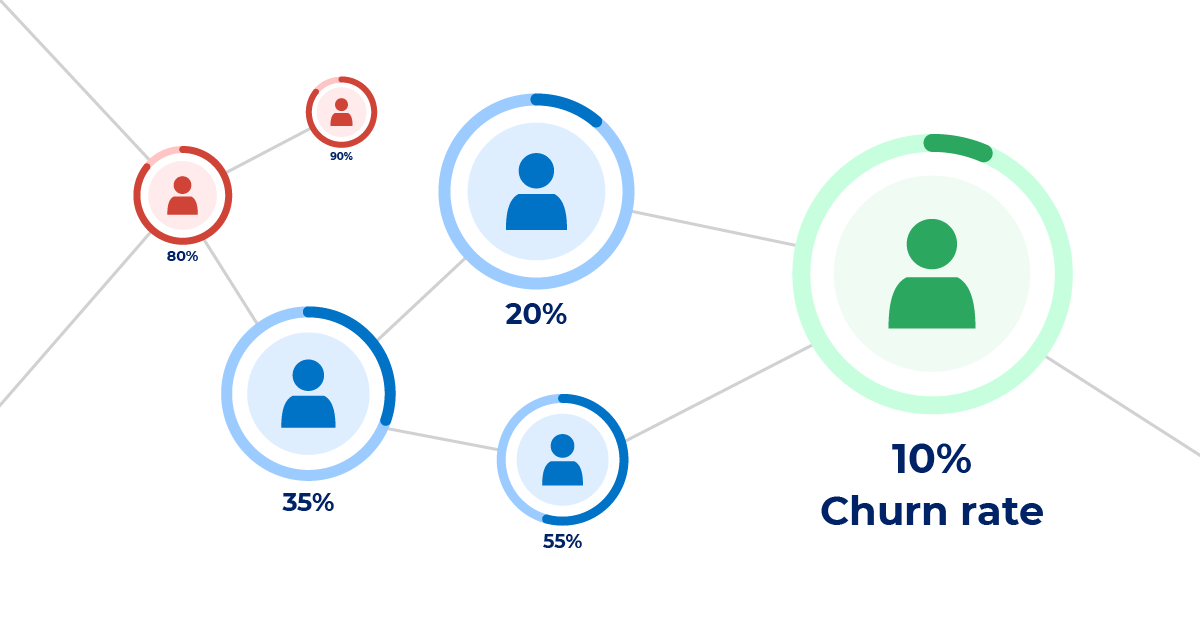
Choose the reporting period and customer population before calculating the rate. Monthly churn is common in subscription businesses, but quarterly or annual measurement may fit companies with longer contracts and renewal cycles.
Step 1: Define an Active Customer
Write down what qualifies an account as active at the beginning of the period. A paid subscriber, an account within a grace period, a paused subscription, and a free-trial user should not be mixed unless the company intentionally defines them as one population.
Step 2: Define the Churn Event
A customer may request cancellation today but retain access until the end of the billing term. Decide whether the churn event occurs when the request is made or when paid access ends.
For non-subscription businesses, define an inactivity window based on a reasonable purchase cycle. A customer who buys annually should not be labeled churned after 30 days without an order.
Step 3: Count Starting Customers
Use the number of active customers at the beginning of the period as the denominator. Do not use the ending customer count because it includes the effect of churn and may include new customers acquired during the period.
Step 4: Count Churned Customers
Count only members of the starting customer group who met the churn definition during the period. Customers acquired and lost within the same period require a separate method or cohort analysis because they were not part of the starting denominator.
Step 5: Apply the Formula
Customer churn rate = churned starting customers ÷ starting customers × 100
Suppose a company begins April with 2,500 customers and 75 of those customers leave before the end of the month:
75 ÷ 2,500 × 100 = 3% monthly customer churn
If the company added 120 new customers during April, those acquisitions affect ending customer count and growth, but they do not change the basic churn calculation for the starting customer base.
Step 6: Label the Result
Report the metric with enough context to interpret it:
April 2026 monthly customer churn was 3% among paying B2B customers active on April 1.
That statement is more useful than “churn was 3%” because it identifies the period and population.
Also Check: How to Do B2B Market Research (A Step-by-Step Guide)
📉 Lower Churn Starts With Better Customers
Cleverly generates higher-intent leads through LinkedIn outreach, pay-per-meeting cold email, and guaranteed cold calling.
Customer Churn Rate Formula
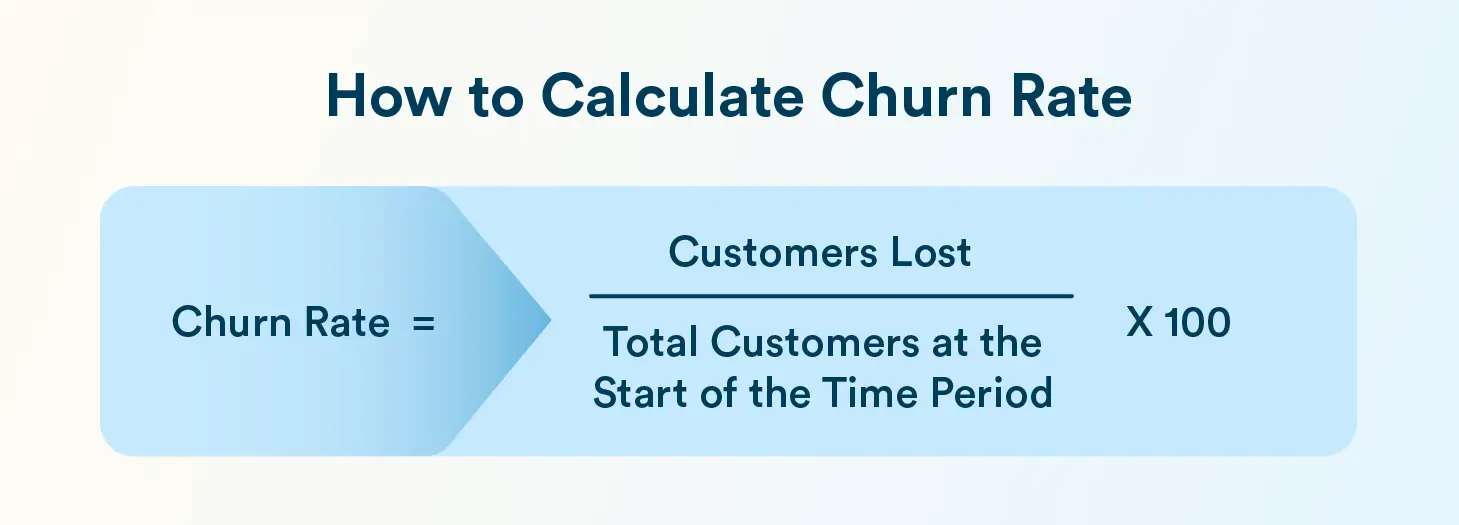
Customer churn measures lost accounts, regardless of how much each account pays.
Customer churn rate = customers lost during the period ÷ customers at the start of the period × 100
Example:
- Starting customers: 800
- Customers lost: 24
- New customers acquired: 35
Customer churn rate = 24 ÷ 800 × 100 = 3%
Do not subtract new customers from lost customers to calculate customer churn. That would measure net customer growth, not churn.
The company finishes the period with:
800 − 24 + 35 = 811 customers
It experienced 3% customer churn and added 11 net customers. Both results can be true at the same time.
How to Calculate Monthly Churn Rate
Monthly churn rate measures customer loss over one calendar month or another consistent monthly reporting window.
Use:
Monthly customer churn rate = customers lost during the month ÷ customers active at the beginning of the month × 100
Suppose a SaaS company starts June with 4,000 paying customers and loses 100 before July 1:
100 ÷ 4,000 × 100 = 2.5% monthly churn
Do not compare this directly with an annual churn benchmark. First confirm that both numbers use the same period and churn definition.
If churn varies significantly during the month or the customer base grows quickly, calculate churn by cohort as well. A blended monthly average can hide unusually high early churn among recently acquired customers.
Revenue Churn Rate Formula
Revenue churn measures recurring revenue lost from existing customers rather than the number of customers who leave. It matters because losing one large account can have a greater financial effect than losing several small ones.
Gross Revenue Churn Formula
Gross revenue churn includes recurring revenue lost through cancellations and downgrades. It does not subtract expansion revenue.
Gross revenue churn rate = recurring revenue lost from cancellations and downgrades ÷ recurring revenue at the start of the period × 100
Suppose a company starts the month with $200,000 in monthly recurring revenue. It loses $8,000 through cancellations and $2,000 through downgrades:
($8,000 + $2,000) ÷ $200,000 × 100 = 5% gross revenue churn
Gross revenue churn cannot be negative because it measures only lost revenue.
Net Revenue Churn Formula
Net revenue churn subtracts expansion revenue generated from the same starting customer group.
Net revenue churn rate = lost recurring revenue + downgrade revenue − expansion revenue ÷ starting recurring revenue × 100
Use parentheses in the calculation:
Net revenue churn rate = (lost recurring revenue + downgrades − expansion) ÷ starting recurring revenue × 100
Using the previous example, assume the company also generated $14,000 in upgrades and add-ons from existing customers:
($8,000 + $2,000 − $14,000) ÷ $200,000 × 100 = −2%
The company has negative 2% net revenue churn. Existing-customer expansion exceeded the revenue lost through cancellations and downgrades.
Do not include revenue from newly acquired customers in this formula. Net revenue churn evaluates the performance of the existing customer base.
Churn Rate vs. Retention Rate
Churn rate measures the share of starting customers lost during a period. Retention rate measures the share that remained.
When both metrics use the same customer population and period:
Customer retention rate = 100% − customer churn rate
If monthly customer churn is 4%, monthly customer retention is 96%.
This relationship becomes less direct when teams mix customer churn, revenue churn, expansion, reactivations, or different cohorts. Net revenue retention, for example, can exceed 100% when expansion revenue is greater than cancellations and downgrades.
Use customer retention to understand how many accounts remain. Use gross revenue retention to understand how much starting revenue remains before expansion. Use net revenue retention to understand how the starting revenue base changes after upgrades, downgrades, and cancellations.
Churn Rate vs. Customer Growth Rate
Churn and growth answer different questions.
Churn asks:
What percentage of starting customers did we lose?
Customer growth asks:
How did the total customer base change after acquisitions and losses?
A company can have high churn and still grow if it acquires customers faster than it loses them. That growth may still be expensive or unstable if the company must replace a large part of the customer base every month.
Suppose a company starts with 1,000 customers, loses 80, and acquires 120:
- Customer churn rate: 80 ÷ 1,000 × 100 = 8%
- Net customer change: 120 − 80 = 40
- Ending customers: 1,040
The company grew by 40 customers despite an 8% churn rate. The acquisition team is outrunning the loss, but the retention problem remains.
Churn Rate Examples
Here's how the formula for churn rate plays out in real business scenarios.
Example 1: SaaS Subscription Platform
- Starting customers: 5,000
- Customers lost in a month: 200
- Churn Rate = (200 ÷ 5,000) × 100 = 4%
A 4% monthly churn rate is substantial when it persists. If the company experienced the same rate every month and acquired no replacement customers, the equivalent compounded annual churn would be approximately 38.7%.
Do not multiply monthly churn by 12 when you need a true annual equivalent. Monthly losses reduce the customer base used in each following month, so the annual calculation must account for compounding.
Example 2: B2B Software Company

- Starting customers: 1,200
- Customers lost: 36
- Churn Rate = (36 ÷ 1,200) × 100 = 3%
A 3% churn rate means the company lost three of every 100 starting customers during the measured period. Whether that result is healthy depends on whether the period is monthly, quarterly, or annual, which customers left, how much revenue they represented, and how the rate compares with similar customer cohorts.
Learn More About: B2B Customer Acquisition (Costs, Benchmarks & Winning Strategies)
What Is a Good Churn Rate?
A good churn rate is lower than the rate your business can profitably replace, but no single percentage applies to every company. A monthly self-service subscription, an annual enterprise contract, and a usage-based product have different opportunities to churn and should not share one benchmark.
Recurly states that subscription businesses commonly experience monthly churn between 1% and 5%, with 4% serving as a broad benchmark in its research. That range should be used as market context, not as a target for every SaaS company. Recurly’s research spans subscription businesses across several industries, not only B2B SaaS.
Benchmark churn against companies with a similar:
- Business model
- Customer type
- Contract length
- Average revenue per account
- Product category
- Acquisition motion
- Measurement method
Your most useful benchmark is the company’s own segmented history. Compare the current cohort with customers acquired through the same channel, on the same plan, in a comparable market, and at a similar lifecycle stage.
A falling company-wide rate can still hide a problem. Enterprise retention may improve while small-business customers leave faster, or existing customers may remain while a newly acquired cohort fails during onboarding.
Types of Churn Businesses Track
Not all churn is the same. A solid churn rate analysis looks at a few different dimensions.
Customer Churn

This is the most basic metric. It counts the number of customers who cancel, leave, or stop renewing. It tells you the raw scale of your retention problem.
Revenue Churn
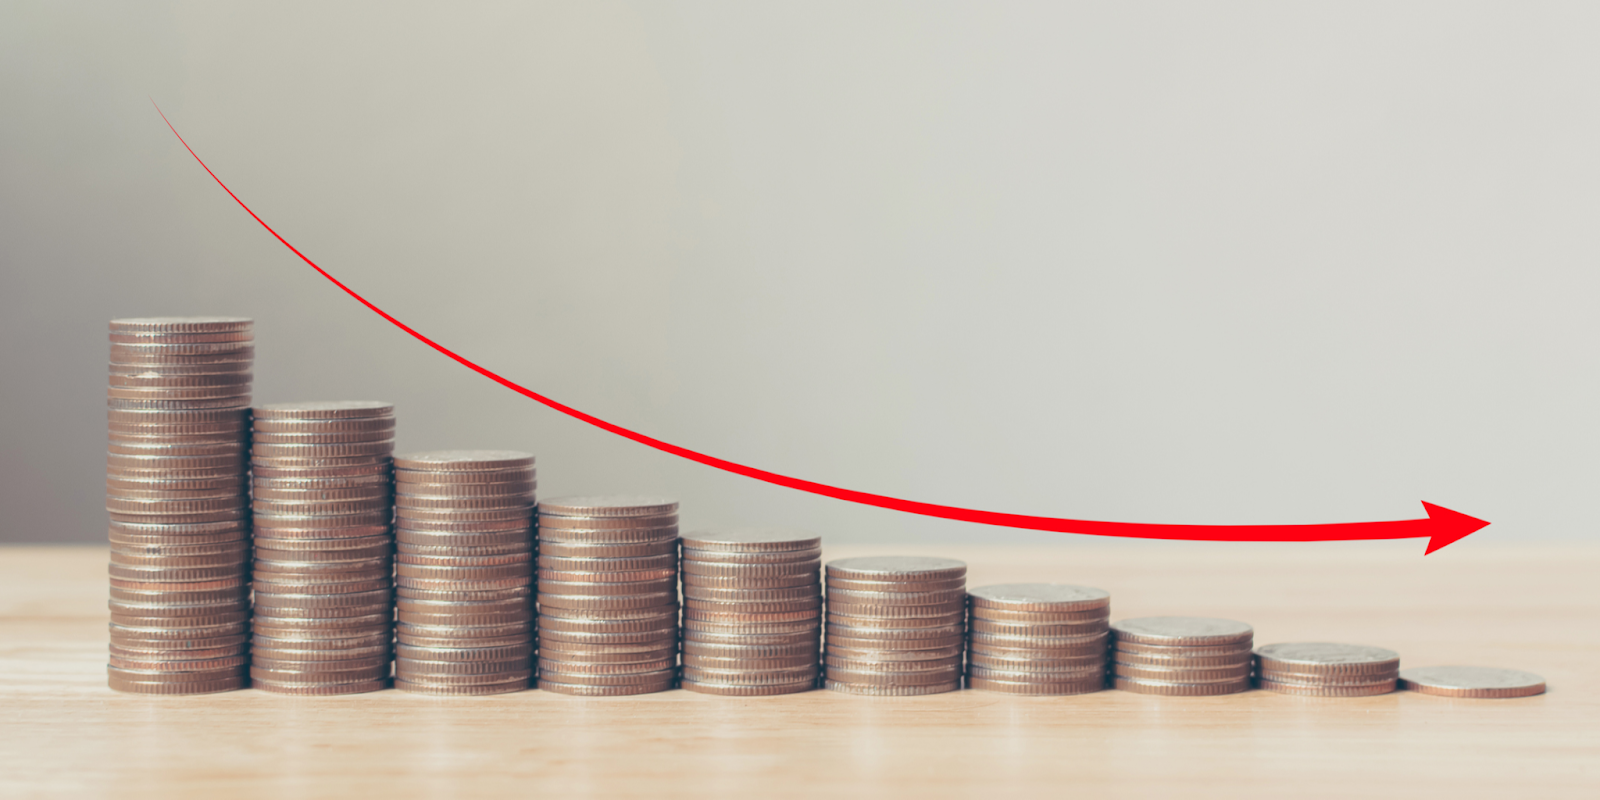
This measures the revenue lost due to cancellations or downgrades, not just customer count. A small number of high-value customers churning can hurt more than a large number of low-value ones.
Gross vs. Net Churn
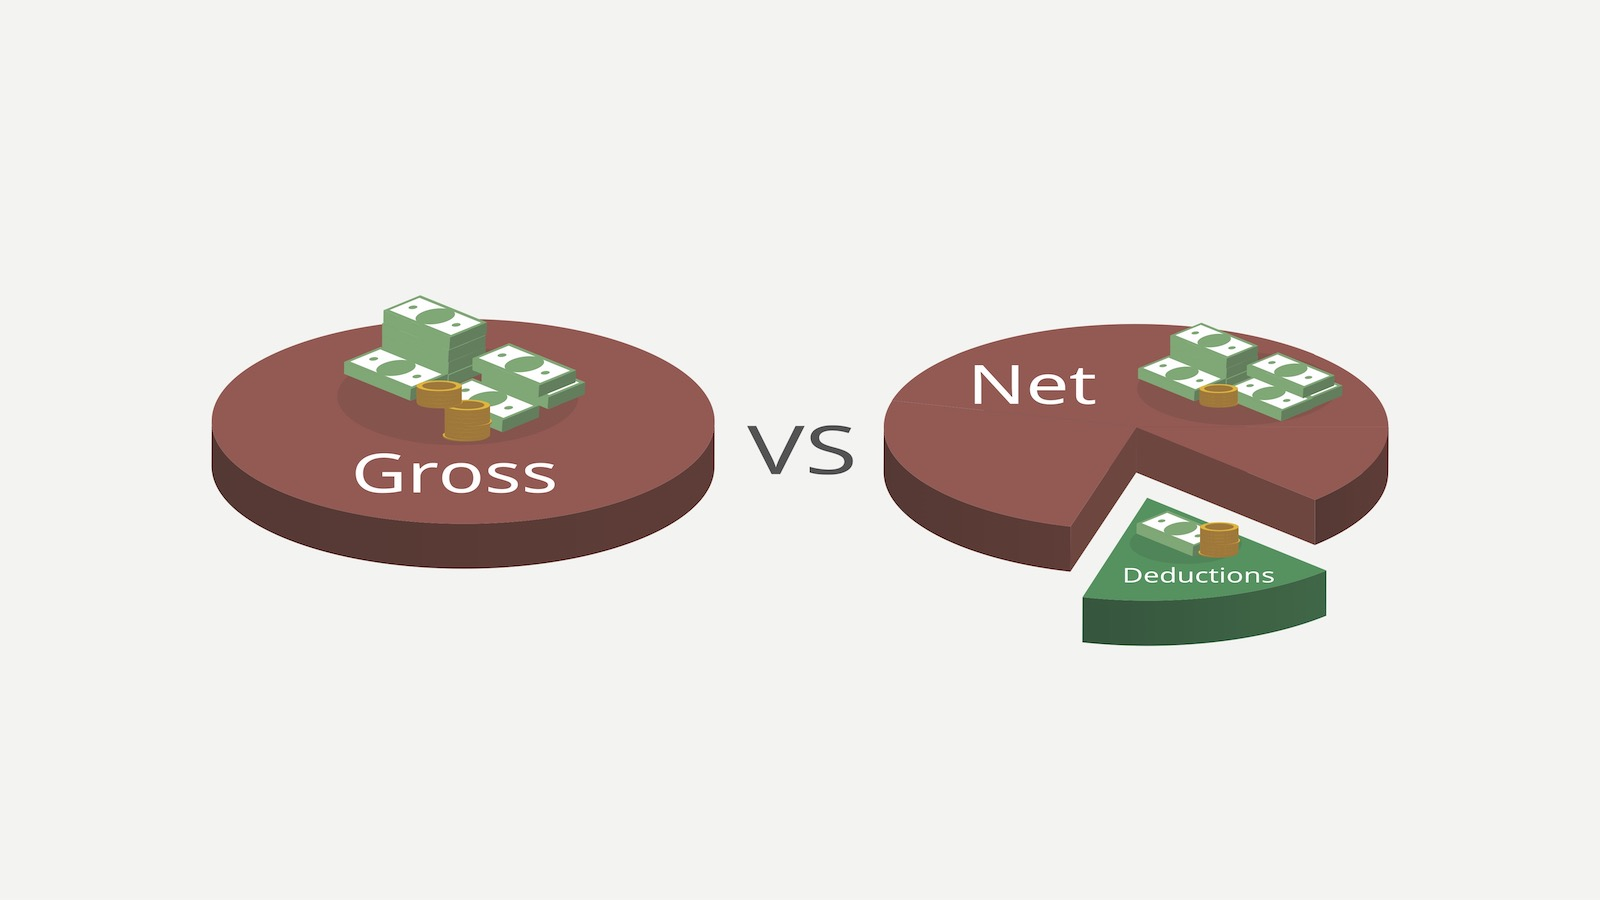
- Gross churn is the total revenue lost from cancellations and downgrades.
- Net churn factors in expansion revenue from upsells and upgrades.
Net revenue churn can be negative when expansion revenue from existing customers exceeds the recurring revenue lost through cancellations and downgrades. Customer churn may still be positive during the same period because some accounts left. The negative figure describes the change in revenue from the existing customer base, not the number of customers lost.
Know the Difference: Selling vs Sales
Common Causes of High Churn
Before you can fix churn, you need to know what's driving it. The most common causes are:
- Poor product-market fit — customers don't see enough value to stay
- Weak onboarding — users never fully adopt the product
- Pricing issues — customers feel they're not getting what they pay for
- Lack of product adoption — users sign up but never build a habit around the tool
- Strong competition — a competitor offers a better deal or experience
Most churn problems come down to one thing: the wrong customers were acquired, or the right customers weren't set up for success.
How Customer Acquisition and Churn Are Connected
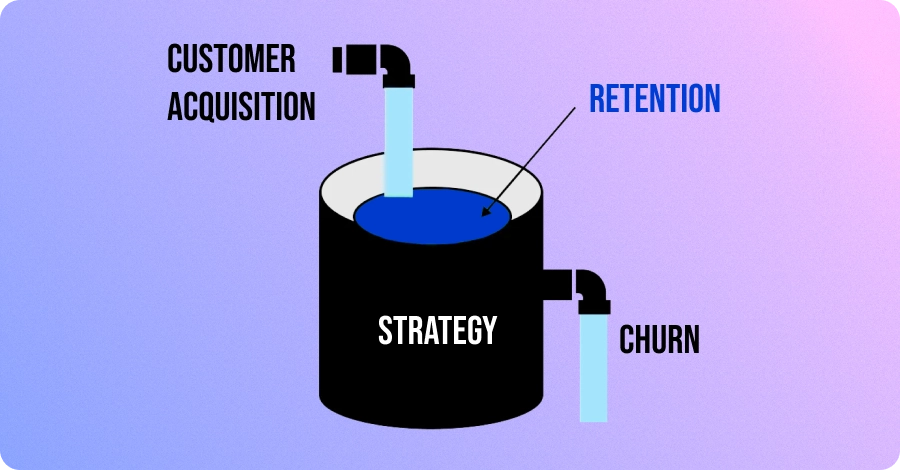
Here's something a lot of companies miss. Churn isn't just a retention problem. It's often an acquisition problem in disguise.
When you bring in customers who aren't a strong fit for your product, they churn faster. That forces you to keep acquiring new customers just to stay flat, which is expensive and exhausting.
Better targeting can reduce avoidable churn by attracting customers whose needs, budgets, expectations, and use cases match the product. It does not replace onboarding, product quality, customer success, pricing discipline, or payment recovery.
Measure churn by acquisition source and campaign. If customers from one source cancel earlier or downgrade more often than comparable customers from another, the issue may begin with audience selection, qualification, offer framing, or expectations set during the sale.
The fix isn't just improving onboarding or customer success. It starts with acquiring the right customers from day one.
Check This: Best Sales Pipeline Management Software for B2B Teams
How Cleverly Helps Companies Acquire Better-Fit Customers

We work with B2B companies every day who are dealing with this exact problem. They're generating leads, but too many of those leads churn early because they were never the right fit to begin with.
As the highest-rated B2B lead generation agency doing 100% done-for-you outbound, we help you fix acquisition at the source.
Here's how we do it:
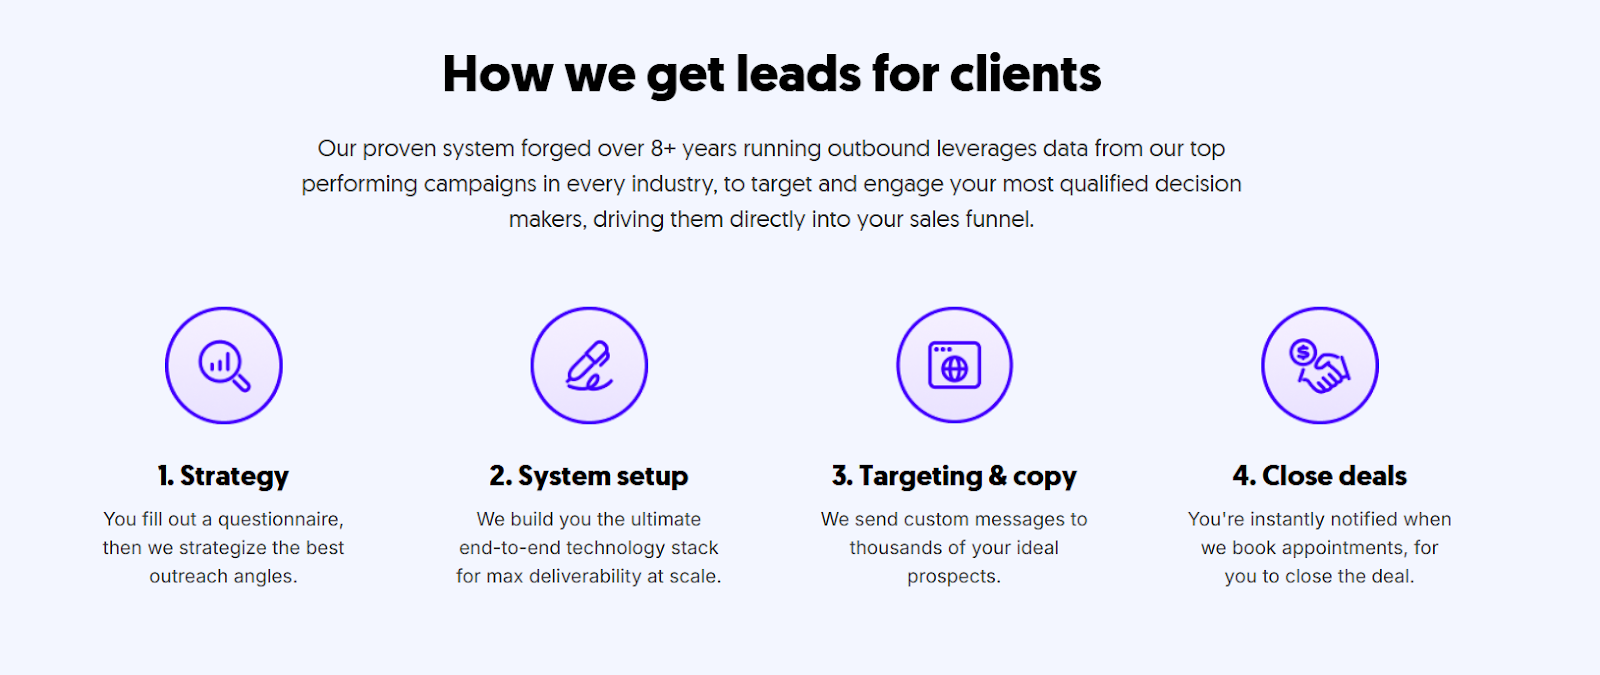
- We define your ICP clearly. Before any outreach goes out, we identify the exact titles, company sizes, industries, and signals that make a prospect likely to convert and retain.
- We target high-fit accounts. No spray and pray. Every campaign is built around accounts that match your best customer profile.
- We run multi-channel outbound. LinkedIn outreach, cold email, and cold calling, all working together to reach your buyers where they are.
Our LinkedIn lead gen and cold email services have helped 10,000+ clients generate leads with companies like Amazon, Google, Uber, PayPal, Slack, and Spotify, generating $312M in pipeline revenue and $51.2M in closed revenue.
LinkedIn packages start at just $397/month, and with cold email, you only pay for meeting-ready leads we send you.
Our cold calling system books you 10–30 qualified sales calls every month, guaranteed. We place a no-accent appointment setter, write breakthrough call scripts, and include all the data, tech, and power dialer. You get half the cost of in-housing with guaranteed appointments, or we replace the SDR. We've made 1M+ cold calls, set 53K appointments, and generated $312M in pipeline.
When your acquisition is dialed in, churn naturally goes down. You're talking to better prospects, closing better-fit customers, and building a book of business that actually stays.
🚀 Let’s get started for you!

Conclusion
Start with a documented customer churn formula: customers lost divided by customers at the beginning of the period. Define the customer population, churn event, and reporting window so the result remains comparable over time.
Then look beyond one percentage. Customer churn shows how many accounts left. Revenue churn shows the financial effect. Cohort and segment analysis show where the loss is concentrated. Voluntary and involuntary churn point to different remedies.
Finally, connect retention with acquisition without confusing correlation with cause. Better customer fit and accurate expectations can reduce avoidable churn, but lasting retention also depends on product value, onboarding, adoption, support, pricing, and billing.
Frequently Asked Questions
Free Resource
How to Scale a Profitable Cold Call System
Get the complete guide — download it instantly now.
Free Ebook
Download the Free Guide
Enter your details to get instant access.
You're all set! 🎉
Your ebook is downloading now.
Click below if the download didn't start automatically.