Modified On :
June 18, 2026
Key Takeaways
- A LinkedIn outreach audit covers 10 distinct layers — targeting, profile, connection note, messaging sequence, CTA, follow-up cadence, offer, account health, list freshness, and tracking — and each maps to a specific metric drop.
- Low connection acceptance rate (below 25%) almost always points to a targeting or sender profile problem, not a copy problem.
- Connection-note reply rates have dropped 37% over the past 12 months, making post-connection message quality the most critical lever to optimize right now.
- Most LinkedIn lead gen campaigns don't fail overnight — they degrade layer by layer, and fixing the wrong layer wastes time and produces no improvement.
- Running a structured LinkedIn prospecting audit every quarter — and immediately after any metric drops 20% or more — is the difference between a campaign that recovers fast and one that stays broken for months.
Your LinkedIn campaign was working. Connection rates were solid, replies were coming in, meetings were getting booked. Then, somewhere along the way, it stopped. The numbers dropped a few points. Then a few more. Then meetings dried up completely.
That's not a LinkedIn problem. That's a campaign problem — and almost every time, it's fixable.
The issue is most teams don't know exactly what to look at. They rewrite copy when the real issue is targeting. They swap out the offer when the real issue is the sender profile. They abandon the channel entirely when the problem was something as simple as pending connection requests piling up and choking the algorithm.
LinkedIn drives 75–85% of all B2B social media leads — but only for teams who know how to use it well. Across 13.2 million connection requests analyzed between May 2025 and April 2026, the platform-wide average connection acceptance rate came in at 28.5%, with a message reply rate of 10.4%. If your numbers are sitting well below those, something specific is breaking down.
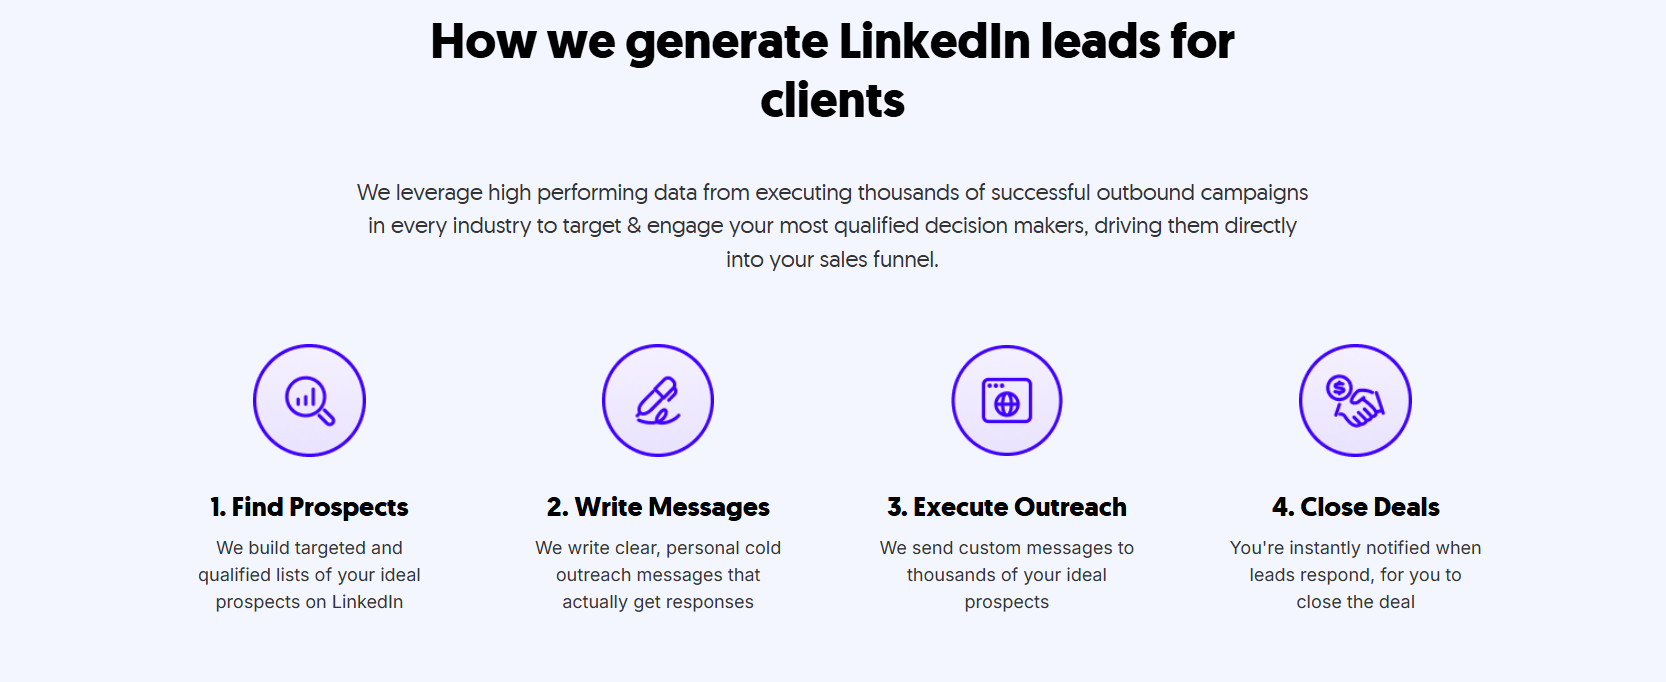
This guide is a structured LinkedIn outreach audit — 10 specific things to check when your campaign stops performing, with what to look for and exactly how to fix it at each step.
What Is a LinkedIn Lead Gen Audit?
A LinkedIn lead gen audit is a systematic review of every layer of your outreach campaign — from targeting and sender profile to copy, sequence, and follow-up — to find exactly where performance is breaking down.
The reason "let's try new copy" rarely fixes anything is because underperformance is almost never a single-layer problem. It's usually two or three things compounding on each other.
You fix the message, but the targeting is still off. You tighten the targeting, but the sender profile still looks generic. You get a higher acceptance rate, but the sequence still pitches too early. Each layer you leave broken cancels out the gain from the layer you fixed.
A LinkedIn prospecting audit works differently. It maps each of the 10 checks to a specific metric — connection acceptance rate, reply rate, positive reply rate, or meetings booked — so you're diagnosing the right layer before touching anything.
Run this audit any time a metric drops from a previously stable benchmark. Run it after a significant list refresh or copy overhaul. And run it as a quarterly health check even when things look fine — because campaigns degrade slowly, and catching it early is far easier than rebuilding from a floor.
📈 Turn a Stalled LinkedIn Campaign Into 15–30 More Meetings Per Month
Our team audits targeting, messaging, deliverability, and conversion data to uncover the hidden issues reducing your campaign performance.
What Good LinkedIn Outreach Performance Actually Looks Like
Before you can audit anything, you need to know what "normal" is. Diagnosing a problem without benchmarks is guesswork.
Here's what current data shows for LinkedIn lead gen optimization in 2026:
A connection acceptance rate below 20% signals targeting or profile issues that need fixing before scaling volume. Cleverly
The diagnostic logic is straightforward:
- Low acceptance rate = targeting or profile problem
- High acceptance but low replies = messaging problem
- Strong replies but few meetings = offer or CTA problem
- Meetings booked but low show rate = qualification or expectation-setting problem
Each drop-off tells you exactly where to look. The audit below works through all 10 layers in order.
The LinkedIn Lead Gen Audit: 10 Things to Check
Work through these in sequence. Each layer feeds the next, so fixing layer 6 when the problem is actually layer 2 won't move your numbers.
1. Your Sender Profile
Your profile is the first thing a prospect sees before they decide whether to accept your request. It's not just a background detail — it's part of the campaign.
What to check: Profile photo (is it professional and clear?), headline (does it speak to the outcome you create for customers, or just list your job title?), About section, recent post activity, and any featured content showing up on the profile.
A sparse profile from a strong sender undermines even the best-written connection note. A credible, active profile from a mediocre note still outperforms the reverse.
What to fix: Treat the sender profile as a campaign asset. Rewrite the headline around the ICP's pain point and what you help them do — not your job title. Make sure the About section reads like someone worth talking to. Check that recent posts are showing up. If the profile looks dormant or generic, prospects see it and decline.
2. ICP Targeting Accuracy
If you're reaching the wrong people, copy changes will never fix your numbers. Targeting problems look exactly like messaging problems on the surface — which is why this is the most common misdiagnosis we see.
What to check: Pull a sample of 50–100 recent connection requests and look at who actually accepted versus who ignored. Are the titles, seniority levels, and company types matching your ICP definition? Or has targeting quietly drifted from "VP of Sales at a 50–500 person SaaS company" to "anyone in sales at any tech company"?
Common targeting drift: using broad industry filters instead of specific title and firmographic combinations, or casting too wide a company size range where the buying behavior and decision-making authority are completely different.
What to fix: Tighten your Sales Navigator filters. Review job title, seniority, company size, geography, and any technographic or activity-based filters that signal real buying intent. The smaller and more precise the list, the higher your acceptance and reply rates will be.
3. Connection Request Note (Or Lack of One)
Whether to use a note or send a blank request is context-dependent — but if you're using a note and your acceptance rate is below 25%, the note itself is almost certainly the problem.
What to check: Does your connection note contain any sales signal — a product mention, a benefit claim, or a meeting ask? Any of those will suppress acceptance rates significantly. Connection-note reply rates dropped 37% over the past 12 months, making the note pathway less reliable as a primary pipeline input.
Personalized connection requests with a relevant note see a 48% acceptance rate, while blank requests average 26% — but "personalized" is doing a lot of work in that sentence. A note that mentions your product or asks for a meeting is not personalized. It's a pitch. And it performs like one.
What to fix: If you're using a note, make it short, specific, and about them — not you. Reference their role, a recent post, or something specific about their company's situation. Remove any ask entirely. Save the CTA for post-connection.
4. Post-Connection Message Sequence
This is the most common failure point in LinkedIn outreach campaigns. Message 2 pitches the product or asks for a meeting before any value has been delivered. Reply rates collapse. The campaign looks broken. The real problem is sequence structure.
What to check: Map your full sequence — message 1 through every follow-up and final touch. Identify exactly where the ask appears and what value, if any, is delivered before it. Then check message length. Shorter messages consistently outperform longer ones — and campaigns with 4–7 touchpoints hit the performance sweet spot, with diminishing returns setting in hard beyond seven touches.
What to fix: Restructure the sequence to lead with a genuinely useful insight, question, or resource in the first post-connection message with zero CTA. No ask, no pitch, no "would love to show you our platform." Introduce the ask only after value has been delivered and you've given the prospect a reason to be interested. Keep every message concise. If you can't say it in under 300 characters, cut it down.
5. CTA Clarity and Ask Timing
A vague CTA leaves the prospect with no clear next step, and reply rates drop even when the rest of the message is strong. "Would love to connect sometime" and "happy to chat if you're open" are both real CTAs that kill conversions at scale.
What to check: What exactly are you asking for, and is it low-friction enough given the relationship stage? Asking for a 30-minute demo on message 2 or 3 is too much too fast. Asking for a reaction to one specific idea — or a yes/no to one pointed question — is not.
Also check timing: are you asking for the meeting before the prospect has had any reason to trust you or respond to you at all?
What to fix: Replace vague CTAs with a specific, low-commitment ask tied to a clear outcome. "Worth a 20-minute call to walk through how we'd approach your setup?" outperforms "let me know if you'd ever like to chat" by a wide margin. The more frictionless and specific the ask, the higher the conversion.
6. Follow-Up Cadence and Number of Touches
55% of all replies come from follow-up touches, not the first message. If your sequence stops after one or two messages, you're leaving the majority of your potential responses on the table.
What to check: How many follow-up messages does your sequence include, and how are they spaced? Are you stopping at message 2 when the data says most replies come later? Also check what your follow-ups are actually doing — are they adding new angles and new value, or just restating the original pitch in different words?
Recommended cadence: Day 0 — connect; Day 2–3 — first message; Day 7 — follow-up with a new angle or resource; Day 14 — final touch or a breakup message that prompts a clear response.
What to fix: Extend the sequence if you're stopping too early. Make every follow-up earn its place with a genuinely new piece of information, angle, or value. Repeating the same pitch with a different subject line produces fast diminishing returns and trains prospects to ignore you.
7. Offer and Value Proposition
If your reply rate is acceptable but your positive reply rate or meetings booked are low, the problem is usually the offer. Prospects are curious enough to respond, but not convinced enough to commit 20 minutes.
What to check: What's the specific outcome your outreach is promising, and is it compelling enough to justify time with a decision-maker who gets 15+ LinkedIn requests every week? 89% of prospects receive over 15 connection requests weekly — your offer needs a reason to stand out.
Weak offers: "we help companies like yours improve X" — vague, generic, no reason to act now. Strong offers: a specific result tied to their situation, a relevant proof point, or a concrete deliverable they can get just by taking the call — an audit, a custom benchmark, a teardown of their current approach.
What to fix: Sharpen the offer to one specific, desirable outcome tied to a pain that's real and timely for your ICP. If you can't articulate the value of the call in one sentence, the prospect won't either.
8. Sending Volume and Account Health
Sending too many requests too fast triggers LinkedIn's spam filters and can result in account restrictions — an invisible performance killer that looks exactly like a targeting or copy problem from the outside.
What to check: What's your current daily send volume? Have you received any warnings or restrictions from LinkedIn? Are you letting pending invitations sit longer than 14 days without withdrawing them?
LinkedIn's weekly connection limit is no longer a fixed number — it adjusts based on your acceptance rate, SSI score, and account history. A strong account can send significantly more requests per week than a flagged one. If you've been hitting warnings and pushing volume anyway, this could be suppressing your entire campaign.
What to fix: If you've received warnings, reduce volume and let the account recover. Withdraw pending requests older than 14 days regularly — letting them pile up signals low-quality targeting to the algorithm. Avoid sudden volume spikes after periods of inactivity.
9. List Freshness and Audience Saturation
Campaigns degrade over time even when targeting, copy, and cadence stay exactly the same. The reason: you've exhausted the best-fit prospects in a segment and are now reaching less-qualified or already-contacted contacts.
What to check: How long has the current target list been in use? Have you already messaged a significant percentage of the most relevant people in this segment? Look at acceptance rate trends over time — if they were higher six months ago and have dropped consistently since, saturation is likely the cause.
Audience saturation is one of the quieter campaign killers. First impressions to a fresh audience consistently outperform repeated exposure to one you've already worked through.
What to fix: Refresh the list with new segments. Add technographic or activity-based filters to surface warmer subsets of your ICP — people who recently changed jobs, companies that just raised funding, or accounts that use a specific tool in their stack. Expand to adjacent titles that share the same pain and buying behavior.
10. Metrics Tracking and Optimization Loop
You can't fix what you're not measuring — and the majority of LinkedIn campaigns that "just stopped working" were never tracked at the level of detail needed to diagnose why.
What to check: Are you tracking connection acceptance rate, reply rate, positive reply rate, and meetings booked as separate metrics? Or are you looking at one combined "leads" number that masks where the actual drop-off is happening?
The diagnostic chain:
- Low acceptance rate → profile or note problem
- Low reply rate → post-connection messaging problem
- Low positive reply rate → offer or ICP precision problem
- Low show rate → qualification or expectation-setting problem
If you're only tracking one number, you'll always be guessing which lever to pull.
What to fix: Build a simple weekly tracking sheet with each metric broken out by campaign, sequence, and message variant. Run a structured review before making any change — so you know what's actually broken before you touch anything.
🚀 See How 10,000+ Companies Fixed Underperforming Outreach
We've helped generate $312M+ in pipeline by identifying the exact campaign bottlenecks that prevent LinkedIn outreach from consistently booking meetings.
What to Do After the Audit
Once you've run all 10 checks, you'll usually find two or three layers contributing to the problem. Here's how to approach fixes without making things worse:
✅ Prioritize by impact
Start with the layer where the biggest metric drop is happening. If acceptance rate is 15%, don't rewrite message 3 — fix targeting and the sender profile first. If acceptance is fine but reply rate is 4%, the sequence is the problem.
✅ Change one thing at a time
Changing copy, targeting, and cadence simultaneously makes it impossible to know what moved the needle. Pick the highest-priority fix and give it enough runway — at least two to three weeks of sends — before evaluating.
✅ Document what you tested
Without a record of what changed and when, the same experiments get repeated, the same mistakes compound, and every new person who touches the campaign starts from zero.
✅ Set a re-audit cadence
Run the full 10-point LinkedIn outreach audit monthly during active campaigns, and immediately any time a metric drops more than 20% from a previously stable baseline. The campaigns that recover fastest are the ones with a structured review process already built in — not the ones scrambling to diagnose after three months of declining numbers.
How Cleverly Diagnoses and Fixes Underperforming LinkedIn Campaigns
When a LinkedIn campaign stops performing, the instinct for most teams is to try something new — new copy, new targeting, a different tool. The real fix is knowing exactly which layer is broken before touching anything else. That's the approach we use at Cleverly for every campaign we manage.
We run a structured review process across all 10 layers covered in this guide whenever a campaign drops from its established benchmark. That means checking ICP targeting accuracy, list freshness, sender profile quality, connection request copy, every post-connection message, offer strength, CTA clarity, and account health — not as a one-off exercise, but as a weekly operational habit.
Every client gets a dedicated account manager who reviews campaign data, runs structured A/B tests on copy and targeting, and communicates what's changing proactively — not on request.
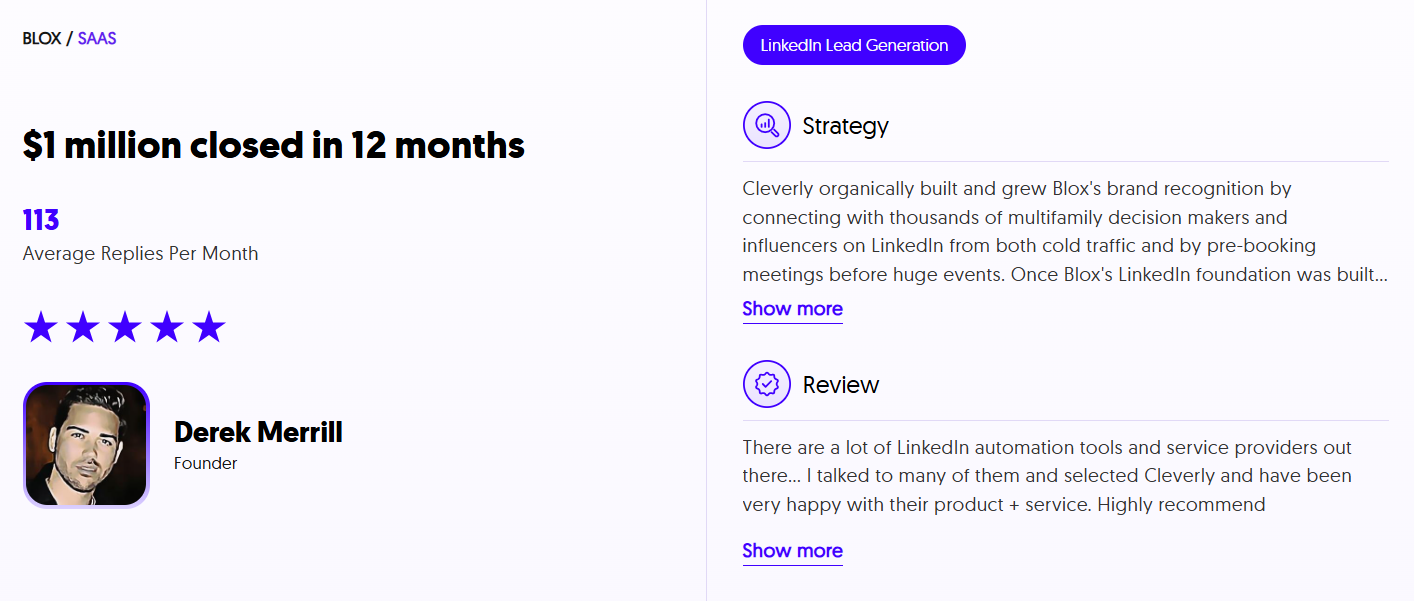
The difference between managing this in-house and running it through Cleverly is benchmark data. We've run LinkedIn lead generation across 10,000+ clients and have real performance data to compare your campaign against — so underperformance gets caught and corrected faster than any internal team working from intuition alone.
We've generated $51.2M in closed revenue and $312M in client pipeline for companies including eBay, Airbnb, DocuSign, Loom, and Airtable — and we're rated 4.6/5 on Trustpilot across 1,136+ reviews.
LinkedIn lead gen starts at $397/month with month-to-month pricing and no long-term contracts.
Is your LinkedIn campaign underperforming? Book a strategy call with Cleverly and we'll run the audit with you — and show you exactly what we'd fix first.
Conclusion
A LinkedIn campaign that stops performing isn't a verdict on the channel. It's a signal that one or more specific layers have broken down and need a targeted fix.
The 10-point audit in this guide gives you a structured way to find exactly where that breakdown is happening — without guessing, without rewriting everything at once, and without abandoning a channel that, with the right adjustments, still produces some of the best pipeline quality in B2B outbound. Run the audit, fix the right layer first, and measure before changing anything else.
Frequently Asked Questions
Free Resource
How to Scale a Profitable Cold Call System
Get the complete guide — download it instantly now.
Free Ebook
Download the Free Guide
Enter your details to get instant access.
You're all set! 🎉
Your ebook is downloading now.
Click below if the download didn't start automatically.