Table of Contents
What Is TAM, SAM, and SOM?
TAM vs SAM vs SOM — Detailed Comparison
How to Calculate TAM, SAM, and SOM
TAM SAM SOM Examples
Common Mistakes When Calculating TAM, SAM, and SOM
Why TAM SAM SOM Matter for B2B Growth Strategy
How Cleverly Helps Companies Reach Their Serviceable Market
Conclusion
Frequently Asked Questions
Modified On :
March 16, 2026
Key Takeaways
- TAM, SAM, and SOM is a three-layer framework that helps businesses understand their total, reachable, and winnable market opportunity.
- TAM represents the full market ceiling if you captured every possible customer, with no filters or limits.
- SAM narrows TAM down to the segments your product can actually serve based on geography, industry, and fit.
- SOM is the most actionable number, reflecting the realistic market share you can win given your competition and resources.
- Confusing TAM with achievable revenue is one of the most common and costly mistakes in market sizing.
- Companies that align TAM, SAM, and SOM with a targeted outbound strategy are better positioned to hit revenue goals faster.
Before you pitch investors or build a go-to-market plan, you need to know one thing: how big is your market?
That's exactly where TAM, SAM, and SOM come in. This framework helps startups and B2B companies figure out:
- Total market potential
- The realistic portion they can actually reach
- The revenue they can realistically win
If you're trying to size your opportunity, plan sales capacity, or attract investors, you need to understand TAM, SAM, and SOM inside and out.
This guide breaks down what each term means, how to calculate them, and real examples to make it click.
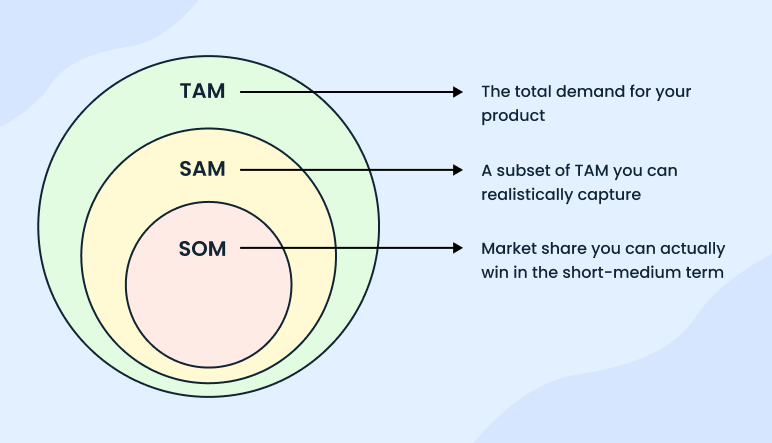
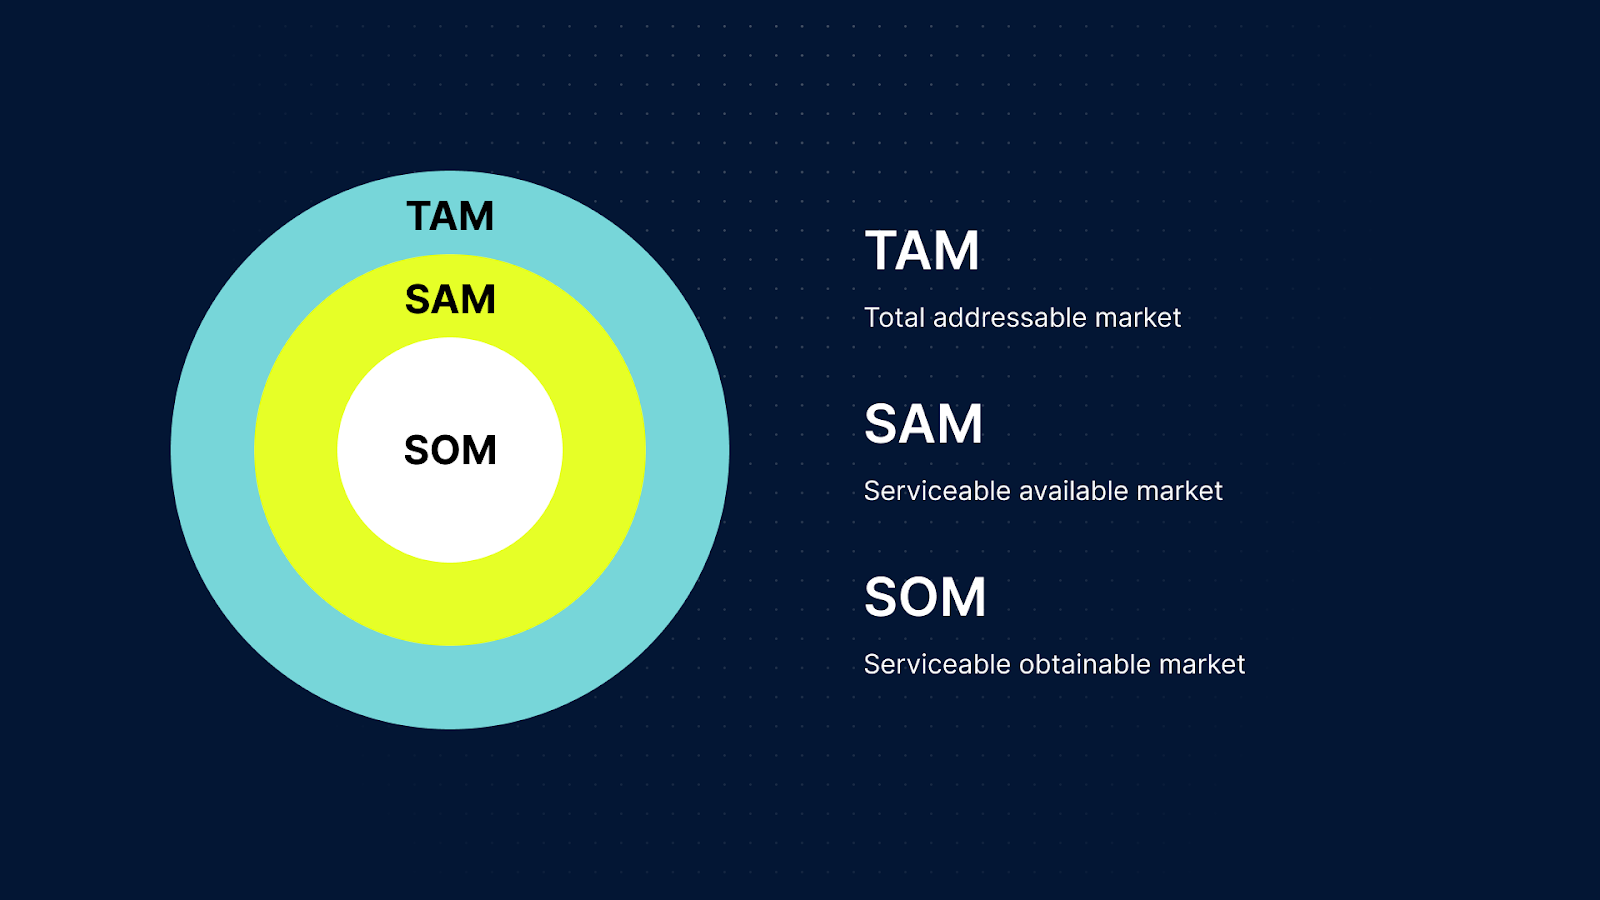
What Is TAM, SAM, and SOM?
What is TAM, SAM, and SOM? Simply put, it's a three-layer market sizing framework. Each layer gets more specific and more realistic.
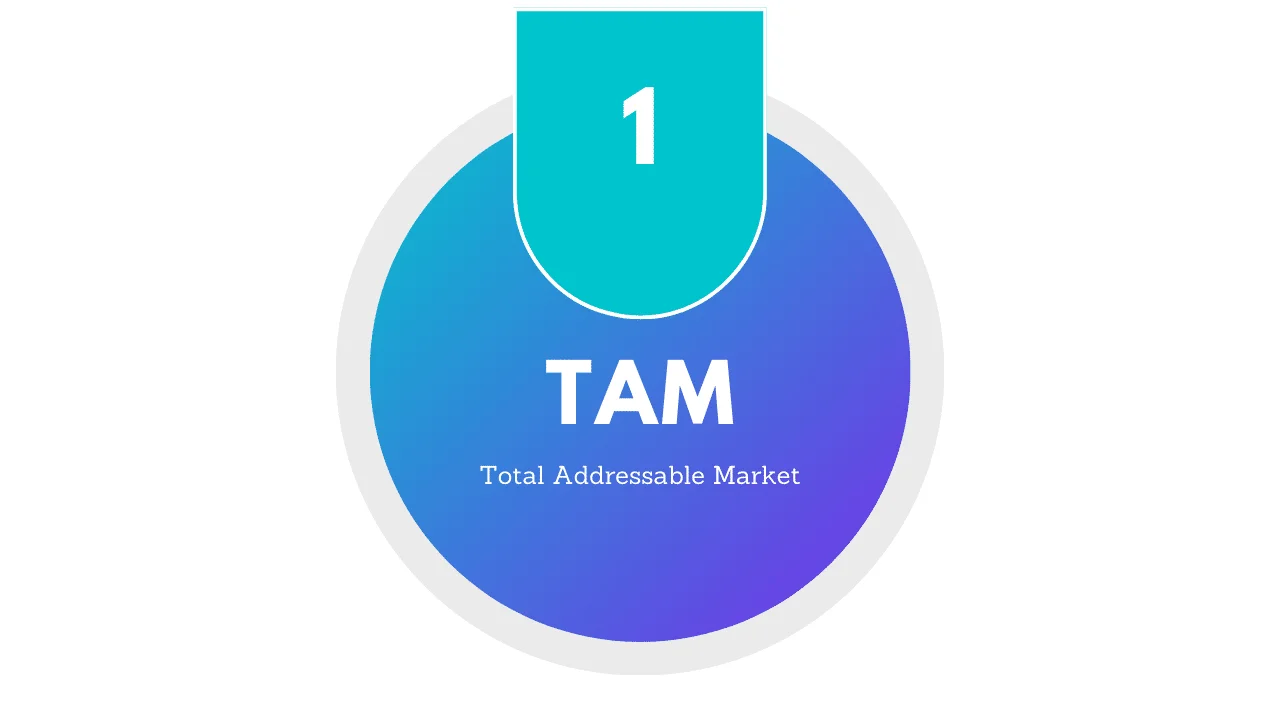
TAM (Total Addressable Market)
TAM is the total demand for your product or service if your company captured 100% of the market. No filters, no limits. It's the full ceiling.
Think of it as: if every potential buyer in the world used your product, what would that revenue look like?
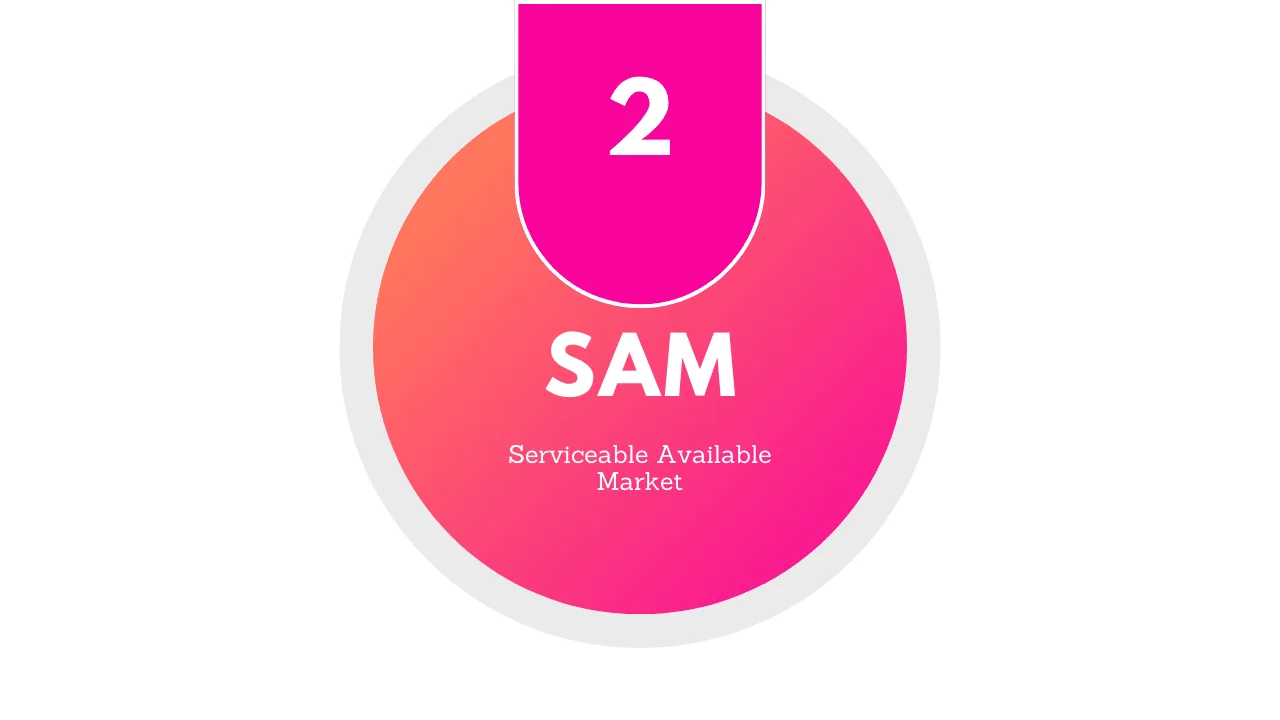
SAM (Serviceable Available Market)
SAM is the slice of TAM your business can actually serve based on your product fit, geography, and target segments. Not every customer in the total market is the right customer for you.
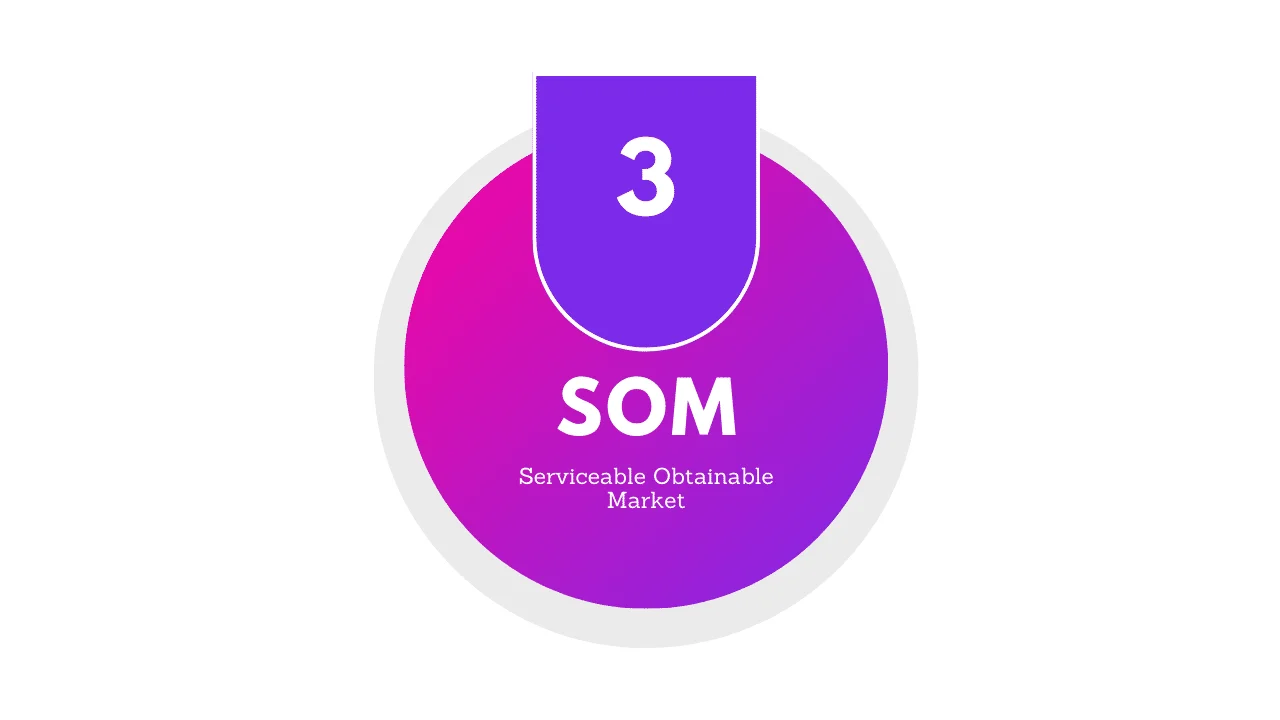
SOM (Serviceable Obtainable Market)
SOM is the realistic portion of SAM you can capture given your competition, sales capacity, and marketing reach. This is the number that actually matters for near-term planning.
The relationship is simple:
TAM → SAM → SOM
Each layer narrows the market down to something more actionable.
🎯 Market Size Is Theory. Pipeline Is Reality.
Cleverly turns your TAM, SAM, and SOM insights into real pipeline using LinkedIn outreach, pay-per-meeting cold email, and guaranteed cold calling.
TAM vs SAM vs SOM — Detailed Comparison
Here's a side-by-side breakdown of TAM, SAM, and SOM to see how they differ:
How to Calculate TAM, SAM, and SOM
Here's how to actually calculate TAM, SAM, and SOM step by step.
Step 1: Calculate TAM
Use this formula:
Potential Customers × Average Revenue Per Customer = TAM
Example: 100,000 potential customers × $500 annual price = $50M TAM
You can approach this two ways:
- Top-down: Start with industry reports and filter down
- Bottom-up: Build from actual customer data and scale up
Step 2: Identify SAM
Filter your TAM by the segments your business can realistically serve:
- Geography — where do you operate?
- Industry — which verticals fit your product?
- Product fit — who actually has the problem you solve?
Example: Of 100,000 companies in your TAM, only 20,000 are in your target region and match your ICP. Your SAM = $10M.
Step 3: Estimate SOM
Now estimate the realistic share of SAM you can capture.
SAM × Realistic Market Share % = SOM
Example: If you capture 5% of a $10M SAM, your SOM = $500K
Your SOM depends on:
- How competitive your market is
- Your current sales capacity
- Your marketing reach and brand awareness
🚀 From Market Analysis to Sales Meetings
10,000+ companies use Cleverly to convert targeted outreach across LinkedIn, email, and phone into sales-ready conversations.
TAM SAM SOM Examples
Let's look at a practical TAM SAM SOM example to see how this plays out.
Example: SaaS CRM Platform
This is exactly how companies frame their opportunity when pitching investors. A $50B TAM grabs attention, but a well-defined SOM of $50M shows you know your market and have a realistic growth plan.
Investors aren't just looking for a big market. They want to see that you understand which part of the market you can actually win.
Read More: 5 Ps of Marketing Explained (With B2B Examples)
Common Mistakes When Calculating TAM, SAM, and SOM
A lot of companies get this wrong. Watch out for these:
❌ Assuming unrealistic market share — claiming 10% of a billion-dollar market in year one is a red flag for investors
❌ Confusing TAM with achievable revenue — TAM is theoretical; it's not your revenue target
❌ Ignoring geographic segmentation — not every market is available to you from day one
❌ Using inaccurate market data — bad inputs lead to bad outputs; use credible sources like Gartner, IDC, or Statista
❌ Failing to validate target segments — your SAM should be based on real ICP research, not assumptions
Getting this right matters. Investors and internal stakeholders both rely on these numbers to make decisions.
Why TAM SAM SOM Matter for B2B Growth Strategy
TAM, SAM, and SOM aren't just for pitch decks. They're a core part of how B2B companies plan and grow.
Here's how they feed into your strategy:
- Identifying high-value market segments — SAM helps you focus on accounts most likely to convert.
- Prioritizing target accounts — SOM tells you exactly where to spend your sales energy.
- Planning sales capacity — knowing your SOM helps you figure out how many SDRs or AEs you actually need.
- Guiding product expansion — TAM shows you where future growth opportunities live.
- Aligning marketing and sales — both teams need the same understanding of who the target market is.
Your go-to-market decisions should flow directly from this framework. If you know your SOM is $5M this year, you can reverse-engineer the pipeline, headcount, and outreach volume needed to hit it.
Here’s More: Target Account Selling - Methodology, Plan & Template for B2B Growth
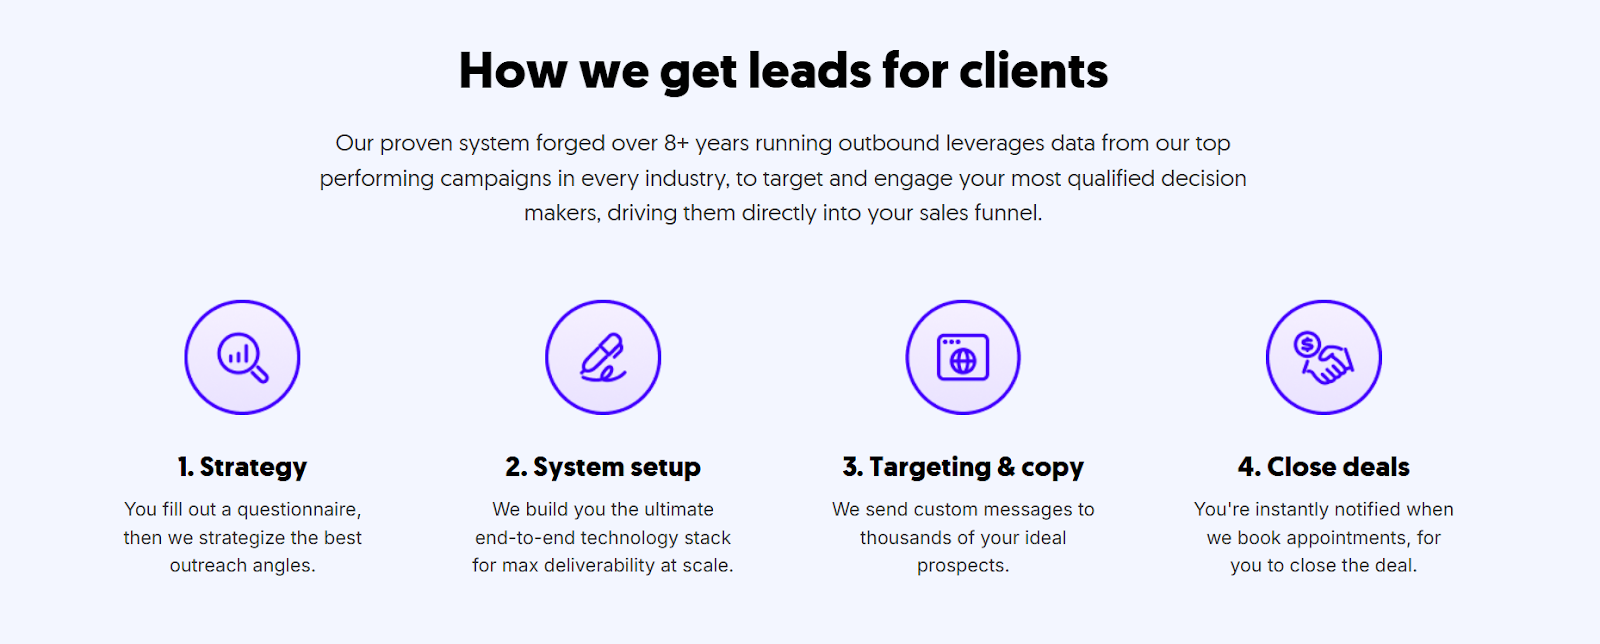
How Cleverly Helps Companies Reach Their Serviceable Market
Knowing your SAM and SOM is one thing. Actually reaching those accounts is another.
That's where we come in. As the highest-rated B2B lead generation agency, we help companies turn their market sizing into real pipeline.
Here's what that looks like in practice:
- Identifying ideal customer segments within your SAM — we help you define and refine your ICP so you're targeting accounts that actually fit.
- Building targeted prospect lists — no generic databases; we build lists based on your specific segments and buying signals.
- Executing multi-touch outbound campaigns — we run LinkedIn outreach, cold email, and cold calling campaigns that hit your best-fit accounts from multiple angles.
- Generating qualified meetings from high-fit accounts — our job is to fill your calendar with the right conversations.
We've helped 10,000+ clients generate leads with companies like Amazon, Google, Uber, PayPal, Slack, and Spotify, resulting in $312M in pipeline revenue and $51.2M in closed revenue through LinkedIn outreach alone.
Our services are built to cover your full outbound stack:
- LinkedIn Lead Generation — starting at just $397/mo
- Cold Email Lead Generation — you only pay for meeting-ready leads we send you
- Cold Calling — our $5M cold calling system books you 10–30 qualified sales calls every month, guaranteed
If you know which market segment you want to win, we'll help you get in front of it.
🚀 Book a FREE Consultation

Conclusion
TAM, SAM, and SOM give you a clear, structured way to understand your market opportunity.
- TAM shows you the total ceiling
- SAM narrows it down to what you can realistically serve
- SOM tells you what you can actually win in the near term
Companies that pair solid market sizing with targeted outbound outreach don't just plan better. They grow faster. Once you know your SOM, the next step is building the pipeline to go after it.
Frequently Asked Questions
Free Resource
How to Scale a Profitable Cold Call System
Get the complete guide — download it instantly now.
Free Ebook
Download the Free Guide
Enter your details to get instant access.
You're all set! 🎉
Your ebook is downloading now.
Click below if the download didn't start automatically.