Table of Contents
Why Most SDR Dashboards Measure the Wrong Things
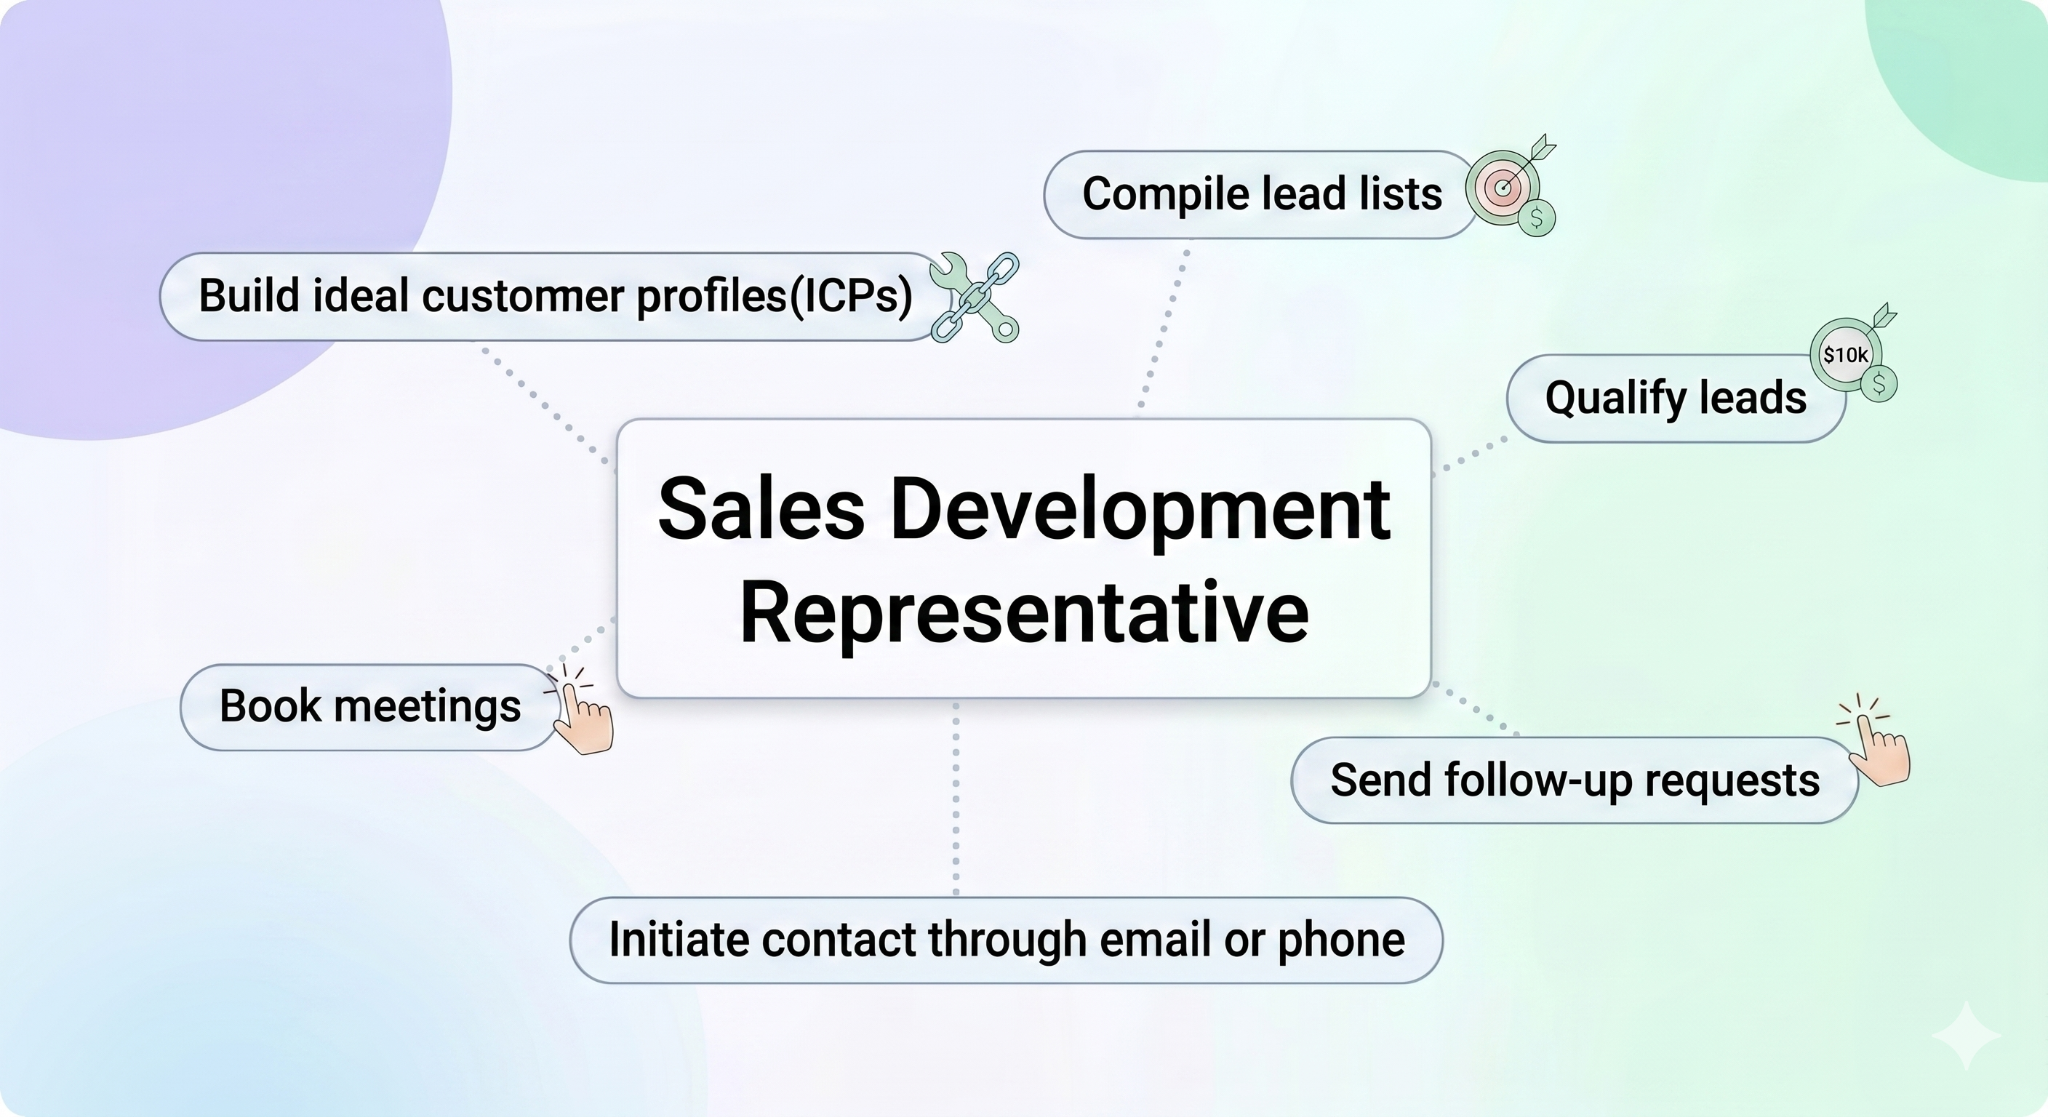
The 3 Categories of SDR KPIs
Activity KPIs: The Leading Indicators
Efficiency KPIs: The Quality Metrics
Outcome KPIs: The Pipeline Metrics
Inbound vs. Outbound SDR KPIs: What Changes
SDR KPI Sample Targets by Team Stage
How to Set SDR KPI Targets That Actually Work
5 SDR KPI Mistakes That Wreck Pipeline Visibility
When It's Time to Outsource Your SDR Function
Conclusion
Frequently Asked Questions
Modified On :
May 20, 2026
Key Takeaways
- The median US B2B SaaS SDR generates $3M in pipeline per year, but the top 10% hit $5–8M — the gap comes down to which metrics they're actually managing.
- Every SDR KPI falls into one of three categories: activity (effort), efficiency (quality), and outcome (impact). You need all three to build a real picture.
- The most important conversion metric isn't meetings booked — it's the meeting-to-AE-accepted-opportunity rate. Target 50%+.
- Show rate and meeting-to-opportunity rate are the two most undertracked SDR metrics and the two most predictive of actual pipeline quality.
- Industry benchmarks are a reference point, not a starting line. Build targets from your own historical data first, then close the gaps with industry data.
The median SDR in US B2B SaaS generates $3M in pipeline per year. The top 10% generate $5–8M.
That's not a gap you close by making more calls. It's a gap that exists because top-performing reps and their managers are tracking the right things and relentless about improving the numbers that actually predict revenue.
The most common mistake in SDR management? Obsessing over activity counts while the metrics that signal real pipeline health stay invisible.
Average SDR quota attainment sits at 43% — more than half of SDR teams miss quota every single month. That's not a motivation problem. It's a measurement problem.
This guide breaks down the 12 SDR KPIs that actually predict pipeline, the 2026 benchmarks for each, the formula to calculate them, and the specific levers to improve them.
If you are a leader trying to figure out why your team is busy but not building a pipeline — this is the guide that makes it click.
Why Most SDR Dashboards Measure the Wrong Things
The activity trap is real. A rep sending 100 emails a day while hitting 1% reply rate is not a high performer — they're running a very expensive spam operation.
A rep making 120 dials with a 3% connect rate has a data problem, not a work ethic problem.
Volume tells you someone showed up. It says nothing about whether what they did was actually working.
SDR metrics and KPIs exist for five real reasons: to evaluate individual performance, set realistic targets, identify funnel leaks, guide coaching conversations, and align SDR activity to revenue goals.
When you reduce your dashboard to activity counts, you lose the ability to do four of those five things.
There's also a time dimension most teams miss. Metrics fall into two buckets:
- Leading indicators — dials, sequences started, conversations had. These predict what's coming. You can change them today and see a different result next month.
- Lagging indicators — meetings booked, pipeline created, opportunities accepted. These confirm what worked. They reflect decisions you made last month.
The best SDR management structure uses leading metrics to coach week-to-week and lagging metrics to evaluate quarterly performance.
Tracking only one type creates blind spots that compound across quarters. Track only activity and you miss pipeline quality. Track only outcomes and you have no idea where the leak is or how to fix it.
📞 Most SDR Teams Track Activity. We Track Revenue.
We run LinkedIn, cold email & calling focused on booked meetings. Done-for-you outbound that drives real pipeline.
The 3 Categories of SDR KPIs
Every SDR metric — no matter how sophisticated your CRM setup is — falls into one of three buckets. The best dashboards have balance across all three.
Optimizing only one category is the single biggest source of bad SDR management decisions:
- Activity without efficiency measurement = noise. You know they're busy; you don't know if it's working.
- Outcomes without activity visibility = a coaching blind spot. When pipeline drops, you have no idea where the breakdown happened.
- Efficiency without outcome tracking = no business impact proof. Great ratios that don't translate to revenue don't justify headcount.
All three categories are required. The 12 SDR KPIs to track below are split across them.
Activity KPIs: The Leading Indicators
Activity metrics set the floor. They tell you whether there's enough top-of-funnel effort to sustain your outcome targets. They don't tell you whether that effort is working — that's what the efficiency metrics are for.
But without a healthy activity baseline, efficiency improvements have nowhere to apply.
1. Dials Per Day
2026 benchmarks: Average outbound SDR: 50–80 dials/day. Top performer: 80–100. With a parallel dialer: 100–150.
Set a floor on daily dials, then optimize for conversation rate — not dial count. The dial floor is just an input check. A rep hitting 100 dials with a sub-5% connect rate doesn't have a volume problem. They have a data problem or a timing problem.
Outbound SDRs typically make 50–80 calls daily, while inbound-focused reps might make 30–50. The right number depends on your motion, tools, and whether calls serve as the primary channel or part of a multi-touch sequence. More isn't always better if call quality suffers.
The best use of the dials-per-day metric: as a starting point for a coaching conversation, not as a performance verdict on its own.

2. Emails Sent Per Day
2026 benchmarks: Average: 30–50 emails/day. Top performer: 50–80.
Volume matters here only in combination with reply rate. If email volume is high but reply rate is flat, you have a personalization problem — not a sequencing problem. Personalized emails pull 3x higher reply rates than templated ones.
Tracking emails sent alongside reply rate is how you catch the rep who's "hitting their email number" by blasting generic copy.
3. Total Touchpoints Per Prospect
2026 benchmarks: Recommended cadence depth: 8–12 touchpoints per prospect before retiring the lead.
This one doesn't get enough attention. 44% of reps stop at touch 1–2; 80% of conversions happen at touch 5+. The persistence gap is where pipeline gets left on the table.
The jump from 17 to 21 attempts per contact is significant — that's roughly 5 social touches, 8 calls, and 8 emails per prospect spread across cadences averaging 53 days. Single-channel outreach just doesn't cut through anymore.
Low touchpoint depth signals premature abandonment. It's one of the cheapest, highest-ROI fixes in SDR management: get reps to run the full sequence before retiring a lead.
🚀 KPIs Matter. But Execution Matters More.
1M+ calls made. $312M pipeline generated. We handle prospecting → outreach → booking—you close.
Efficiency KPIs: The Quality Metrics
Efficiency metrics tell you where the effort is leaking. Two reps making the same number of dials can produce wildly different outcomes depending on data quality, messaging quality, and how they handle the first 10 seconds of a conversation. These are the most important SDR KPIs for coaching.
4. Connect Rate (Dial to Live Conversation)
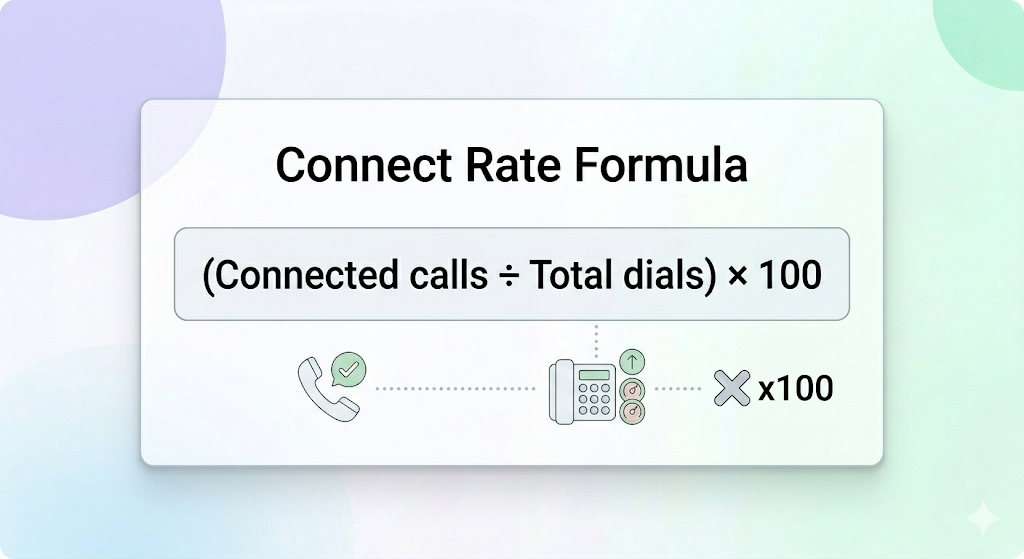
2026 benchmarks: 8–12% on standard data; 20–30% on verified mobile direct dials; 25–35% for top performers.
Most teams land around 6% connect rate. The old 15–20% figures from 2021–2022 are outdated. Phone number quality is the biggest variable — teams using verified mobile data consistently hit the upper end of that range.
A connect rate below 5% is almost always a data quality problem, not a rep performance problem. Fix the list before coaching the rep. Verified mobile direct dials alone can double connect rate without changing the rep's script, timing, or volume.
5. Conversation Rate (Connected to Real Dialogue)
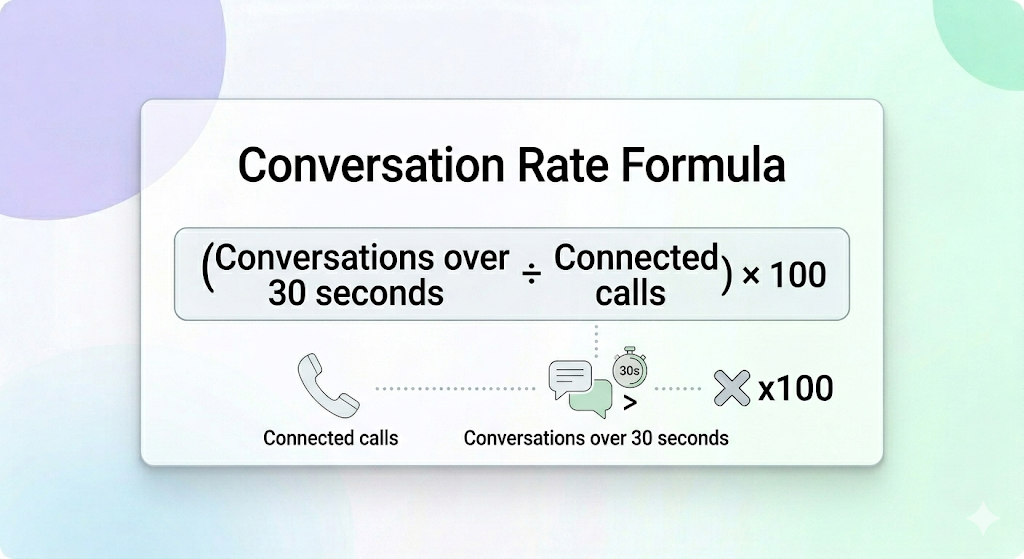
2026 benchmarks: 50–60% (average); 70–85% (top performer).
A connected call and a real conversation are different things. This metric tracks how often you get the right person on the line and actually have a dialogue — versus a quick brush-off.
The biggest lever here is the opening line. A pattern-interrupt opener keeps the prospect curious for the next 15 seconds. A generic "I wanted to reach out about your company's challenges" gets you a dial tone.
If your conversation rate is below 50%, the rep is getting the right person on the line but losing them immediately. That's a script problem, not a dial problem.
6. Conversation to Meeting Conversion Rate
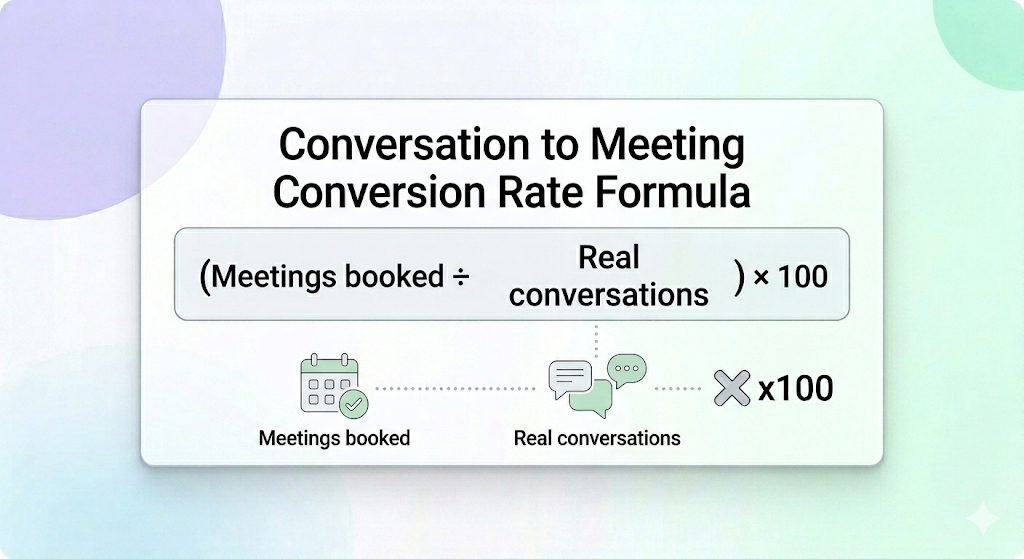
2026 benchmarks: 10–15% (average); 20–30% (top performer).
This is where the sales skill shows up. Top reps identify pain in the first 30 seconds and tie it to a specific outcome. Average reps pitch the product and ask for a meeting. The difference in conversion rate between those two approaches is 10–15 percentage points.
A low rate here is always a script or qualification problem, never a volume problem. If a rep is having real conversations but not converting them to meetings, more dials won't fix it.
7. Email Reply Rate

2026 benchmarks: 1–3% (generic/templated outreach); 5–10% (personalized); 10–20% (email following a voicemail).
When tracking email reply rate, track positive reply rate separately from total reply rate. A 10% total reply rate with 8% of replies being "remove me from your list" tells a very different story than a 6% total reply rate with 5% being genuine interest.
Email reply rates dropped from 6.8% in 2023 to 5–6% in 2025, a 15% decline in one year. If your benchmarks haven't been updated recently, your team may be chasing numbers that no longer reflect the actual environment.
8. Activities Per Booked Meeting
Formula: Total activities (calls + emails + LinkedIn touches) ÷ Meetings booked
2026 benchmarks: 50–100 activities per meeting (average team); 30–50 (optimized team).
Teams using coordinated multi-channel sequences (email + call + LinkedIn in the same cadence) book meetings at roughly half the activities-per-meeting rate of single-channel teams.
This is your efficiency score. Track the 90-day trend, not the absolute number. A spike in activities per meeting is a leading signal of messaging drift or ICP mismatch — both of which you want to catch before they show up in pipeline two months later.
Outcome KPIs: The Pipeline Metrics
Outcome metrics are lagging indicators. They measure what happened as a result of last month's activity and efficiency. These are what you evaluate reps on at the end of a quarter, but not what you coach against week-to-week.
Three outcome metrics give you 80% of the picture: meetings held, meeting-to-opportunity rate, and pipeline created.
9. Meetings Booked Per Month

2026 benchmarks:
- Average outbound B2B SaaS SDR: 12–15/month
- Top performer: 20–25/month
- Inbound/warm leads: 25–40/month
- Enterprise/ABM (high ACV): 5–10/month
This is the headline activity metric — but it's misleading without show rate and opportunity conversion attached. Raw bookings without qualification context is a vanity metric.
A team booking 40 meetings per month where only 4% enter pipeline is generating 1.6 real opportunities per month from a full SDR team. The meeting quota was green. The pipeline was nowhere.
10. Show Rate (Booked to Attended)

Formula: (Meetings attended ÷ Meetings booked) × 100
2026 benchmarks: 70–80% (average); 85–90% (top performer).
Outbound show rates land around 75–80%, which means "meetings booked" overstates pipeline input by 20–25%. Always measure meetings attended, not meetings booked.
The math is straightforward: a rep booking 20 meetings at 50% show rate (10 attended) underperforms a rep booking 15 at 90% (13.5 attended). Show rate is a qualification signal as much as a logistics signal. Reps with low show rates are usually either under-qualifying on the booking call or skipping confirmation sequences.
Top levers: same-day confirmation email, day-before calendar reminder, day-of text, and deep qualification during the original booking call.
11. Meeting to AE-Accepted Opportunity Rate
Formula: (AE-accepted opportunities ÷ Meetings attended) × 100
2026 benchmarks: 40–60% (average); 60–75% (top performer). Target: 50%+.
This is the real metric that predicts pipeline. The math is decisive: hitting 25 meetings at 30% acceptance gives you 7.5 accepted opportunities. Hitting 15 meetings at 70% acceptance gives you 10.5. Quality beats volume significantly here.
Sales Accepted Lead to Sales Qualified Lead conversion runs about 50% — roughly 1 in 2 meetings leads to a genuine next step. If your number is well below that, the problem is usually upstream: qualification criteria are too loose, or SDRs are booking meetings with non-decision-makers to hit activity targets.
Low acceptance rate is where the SDR/AE handoff alignment lives or dies. If AEs are rejecting more than 50% of what SDRs are sending them, you don't have a rep problem — you have an alignment problem.
12. Pipeline Generated Per Month
Formula: Sum of opportunity values from SDR-sourced meetings
2026 benchmarks: $150–250K/month (average SDR); $300–500K/month (top performer); $3M/year median (Bridge Group).
This is the headline outcome metric. Everything else feeds this number. SDRs generate between 46% and 73% of pipeline conversion depending on company stage. That makes SDR-sourced pipeline one of the most significant inputs to revenue in a B2B SaaS company.
Track SDR-sourced pipeline separately from marketing-sourced pipeline. Blending them hides the real cost and ROI of your outbound motion, and makes it nearly impossible to make smart headcount or spend decisions.
Inbound vs. Outbound SDR KPIs: What Changes
The same three categories apply to both motions. The benchmarks differ significantly. One of the fastest ways to create broken expectations is to hold inbound and outbound SDRs to the same targets.
The average B2B company takes 42 hours to respond to an inbound lead. By then, the prospect has often booked a demo with a competitor. Speed to lead is the single most leveraged inbound SDR metric — a 5-minute response delivers up to a 400% conversion lift over a 10-minute response.
Outbound SDRs own their own pipeline from scratch. Inbound SDRs are gatekeepers for marketing-sourced leads. Different motions, different benchmarks, different coaching conversations. Normalize by motion type before comparing reps.
SDR KPI Sample Targets by Team Stage
Industry benchmarks are a reference, not a starting point. Build targets from your own historical data first, then use the table below to identify where the gaps are.
On ramp time: the Bridge Group puts average SDR ramp at 3.1 months; teams with structured 30-60-90 day onboarding can compress this to 60 days. Month 1 = zero quota (learning), Month 2 = 50% quota, Month 3 = 75–100%.
A rep who isn't at 50% by day 60 with full coaching support and clean data is a fit issue, not an effort issue. Don't wait until month 4 to have that conversation.
How to Set SDR KPI Targets That Actually Work
Setting targets that stick requires a specific sequence. Get this out of order and you'll end up with either demoralizing quotas or benchmarks so easy they obscure real performance.
✅ Step 1
Pull 3–6 months of historical data. Your team's current conversion rates are the starting line. If you don't have clean historical data, that's the first problem to fix — you can't improve what you can't measure.
✅ Step 2
Benchmark against industry. Use the tables in this guide to identify gaps. The gaps tell you where the highest-leverage improvements are. If your connect rate is at 6% and industry top performers are at 20–30%, that's a data quality problem worth solving before anything else.
✅ Step 3
Set SMART targets. Specific, measurable, achievable, realistic, time-bound. Not "improve meetings booked" — "move from 12 to 15 meetings per month by end of Q2 through a combination of improved data quality and two additional touchpoints per cadence."
✅ Step 4
Identify the lever for each gap. To book more meetings, you can increase dials (activity), improve connect rate through better data (efficiency), or improve the opener/script (efficiency). Ideally all three. Knowing the lever prevents the lazy fix of just telling reps to "work harder."
✅ Step 5
Review quarterly, not weekly. Pick 5–7 core metrics and track them for at least two quarters before changing anything. Constant dashboard changes hide trends and create confusion. Stability in what you're measuring is a precondition for improvement.
5 SDR KPI Mistakes That Wreck Pipeline Visibility
Tracking only activity
100 dials with zero meetings is not performance. It might be data quality, targeting, messaging, or timing — but it's not performance. All three categories are required.
Comparing without context
A rep covering C-suite enterprise accounts will always have a lower connect rate than a rep working SMB managers. Normalize by ICP, territory, and ACV before comparing reps against each other or against team averages.
Changing KPIs every month
Constant dashboard churn hides trends and confuses the team. Commit to 5–7 core metrics for at least two full quarters before making changes. The signal you're looking for only becomes visible with consistent measurement over time.
Ignoring show rate
An SDR booking 20 meetings at 50% show rate (10 attended) underperforms one booking 15 at 90% (13.5 attended). Always track meetings attended, not meetings booked. This single swap changes how you evaluate rep performance.
Compensating on volume
Pay reps on raw meeting count and you'll get unqualified meetings. Tying variable comp to more than 2–3 metrics dilutes focus and breeds gaming. Tie compensation to AE-accepted opportunities and pipeline generated — the metrics that actually connect to revenue.
When It's Time to Outsource Your SDR Function
Building an SDR team from scratch requires a 3+ month ramp window, $50K–$70K+ per rep in salary, tools, and management overhead, and a proven outbound playbook to train against.
The pipeline impact lags by a full quarter before you see real results. For companies that need pipeline now — not pipeline in 90 days — that math doesn't work.
At Cleverly, we run a fully done-for-you outbound system that covers everything an in-house SDR team would: ICP targeting, verified list building, outreach execution across LinkedIn, cold email, and cold calling, and delivery of qualified meetings to your calendar.
Our reps are already ramped, scripts are already tested, and the infrastructure is already in place. There's no 3-month ramp period eating into your pipeline.
We've helped 10,000+ B2B companies — including teams at Amazon, Google, Uber, PayPal, Slack, and Spotify — generate $312M in pipeline and $51.2M in closed revenue.
The metrics we're accountable to aren't just activity volume — they're qualified meetings booked, show rate, and pipeline created. The same SDR KPIs this guide is built around.
🚀 LinkedIn outreach starts at $397/month.
🚀 Cold email lead gen runs on a pay-per-lead model, so you only pay for meeting-ready leads we actually deliver.
🚀 Cold calling comes as a complete system — dedicated no-accent appointment setter, custom scripts, power dialer, data, and training included — for one flat monthly investment, at half the cost of hiring in-house, with guaranteed appointments or SDR replacement.
If you're spending more time managing an SDR function than closing deals, that's the signal. Book a strategy call with Cleverly and we'll show you what a fully optimized outbound system looks like for your specific ICP.

Conclusion
Three metrics give you 80% of the SDR KPI picture: meetings held (not booked), meeting-to-opportunity rate, and pipeline generated. Everything else feeds those three. If your team is tracking activity but missing pipeline, that's the diagnostic framework to start with.
The 2026 benchmarks to internalize: 12–15 meetings per month for the average outbound SDR, 50%+ meeting-to-opportunity rate, $3M pipeline per year as the median. Build targets from your own baseline first, then close gaps using industry data.
Show rate and meeting-to-opportunity rate are the two most undertracked metrics and the two most predictive of real pipeline quality. Five to seven metrics, tracked consistently, reviewed quarterly — that's the framework that works.
Frequently Asked Questions
Free Resource
How to Scale a Profitable Cold Call System
Get the complete guide — download it instantly now.
Free Ebook
Download the Free Guide
Enter your details to get instant access.
You're all set! 🎉
Your ebook is downloading now.
Click below if the download didn't start automatically.