Table of Contents
Why Most SDR Teams Are Measuring Cold Calling Wrong
The 8 Cold Calling Metrics You Must Be Tracking in 2026
How to Use These Metrics to Build a Cold Calling Improvement System
How Cleverly Tracks and Optimizes Cold Calling Performance for B2B Clients
Conclusion
Frequently Asked Questions
Modified On :
April 22, 2026
Key Takeaways
- The industry average cold calling success rate is 2.7% in 2026 — but top-performing teams are hitting 11%+ by measuring and iterating on the right metrics, not just dialing more.
- Dial-to-connect rate is your first diagnostic signal — if it's below 5%, the problem is almost always bad data or a flagged caller ID, not rep performance.
- Conversation-to-meeting rate is the most actionable coaching metric on this list — average reps convert at 4.6%, while top performers hit 16.7%.
- Caller ID health is the most underrated cold calling KPI in 2026 — a "Spam Likely" label means 95%+ of your calls go unanswered before a single conversation happens.
- Pipeline generated per SDR is the only metric that directly connects cold calling activity to revenue — everything else is a leading indicator feeding into this number.
- Fixing the right funnel stage fixes the right problem — don't coach reps on objections when the real issue is a broken list.
- Build a weekly review cadence around these 8 metrics and improvement becomes compounding, not a guessing game.
Dials made. Talk time. Emails sent. These are inputs — they tell you how busy your team is, not how effective it is. And in 2026, busy without effective is a fast path to a missed quota.
Cold calling's average success rate sits at 2.3% based on analysis of 204,000+ calls. But the conversation success rate — once you actually get someone on the phone — is a much healthier 65.6%. That gap tells the whole story: the problem isn't what reps say, it's reaching the right person in the first place.
Quality conversations per day have dropped to just 3.6 — a 55% decline since 2014 — forcing teams to make every single interaction count. In this environment, the teams that win are the ones treating cold calling metrics like a diagnostic system, not a scorecard.
This guide walks through the 8 cold calling metrics to track in 2026 — what each one measures, what the benchmarks actually look like, and exactly what to do when your numbers fall short.
Why Most SDR Teams Are Measuring Cold Calling Wrong
The Dials-Obsessed Trap
There's a version of sales management that looks like this: pull up the activity dashboard, count the dials, tell the rep to make more. It feels like accountability. It's actually just noise.
Dials are an input metric. They tell you what your team did, not what happened as a result. A rep who makes 150 dials with a burned number, a stale list, and a weak opener is generating zero pipeline — and the dials metric will never show you why.
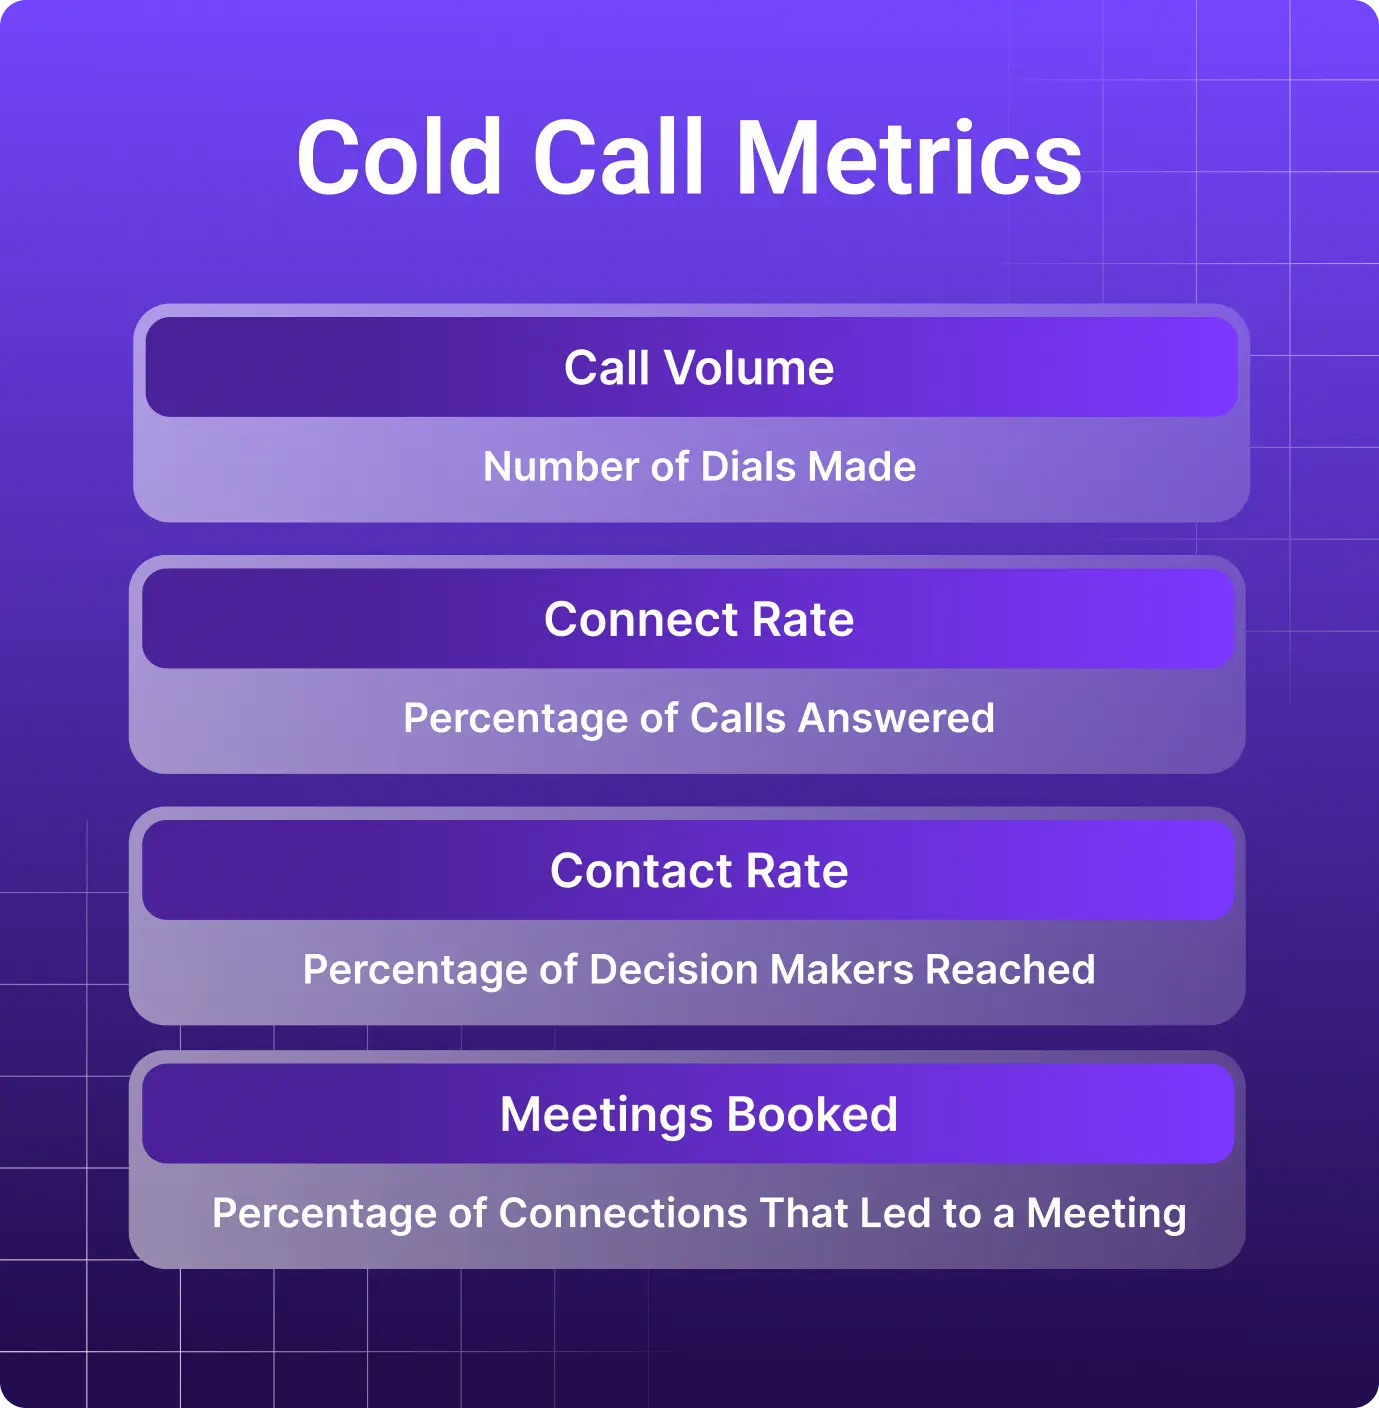
The cold calling KPIs that actually matter map to outcomes: connects, conversations, meetings, held meetings, pipeline. Each stage of that funnel can break for a completely different reason — and the fix is different every time.

Vanity Metrics vs. Diagnostic Metrics
Common vanity metrics most teams report:
- Total dials per day
- Total talk time
- Number of voicemails left
What these tell you: your rep was active.
What they don't tell you: whether anything that rep did moved a deal forward.
The diagnostic cold calling sales metrics — connect rate, conversation rate, meeting held rate, pipeline per rep — are the ones that actually let you trace a performance problem back to its source.
Is connect rate low? Probably a data or caller ID issue.
Is conversation-to-meeting rate low? Probably a script or persona-targeting issue.
Is meeting held rate low? Probably a conversation quality issue — your reps are booking meetings before the prospect is actually qualified.
The Cold Calling Conversion Funnel
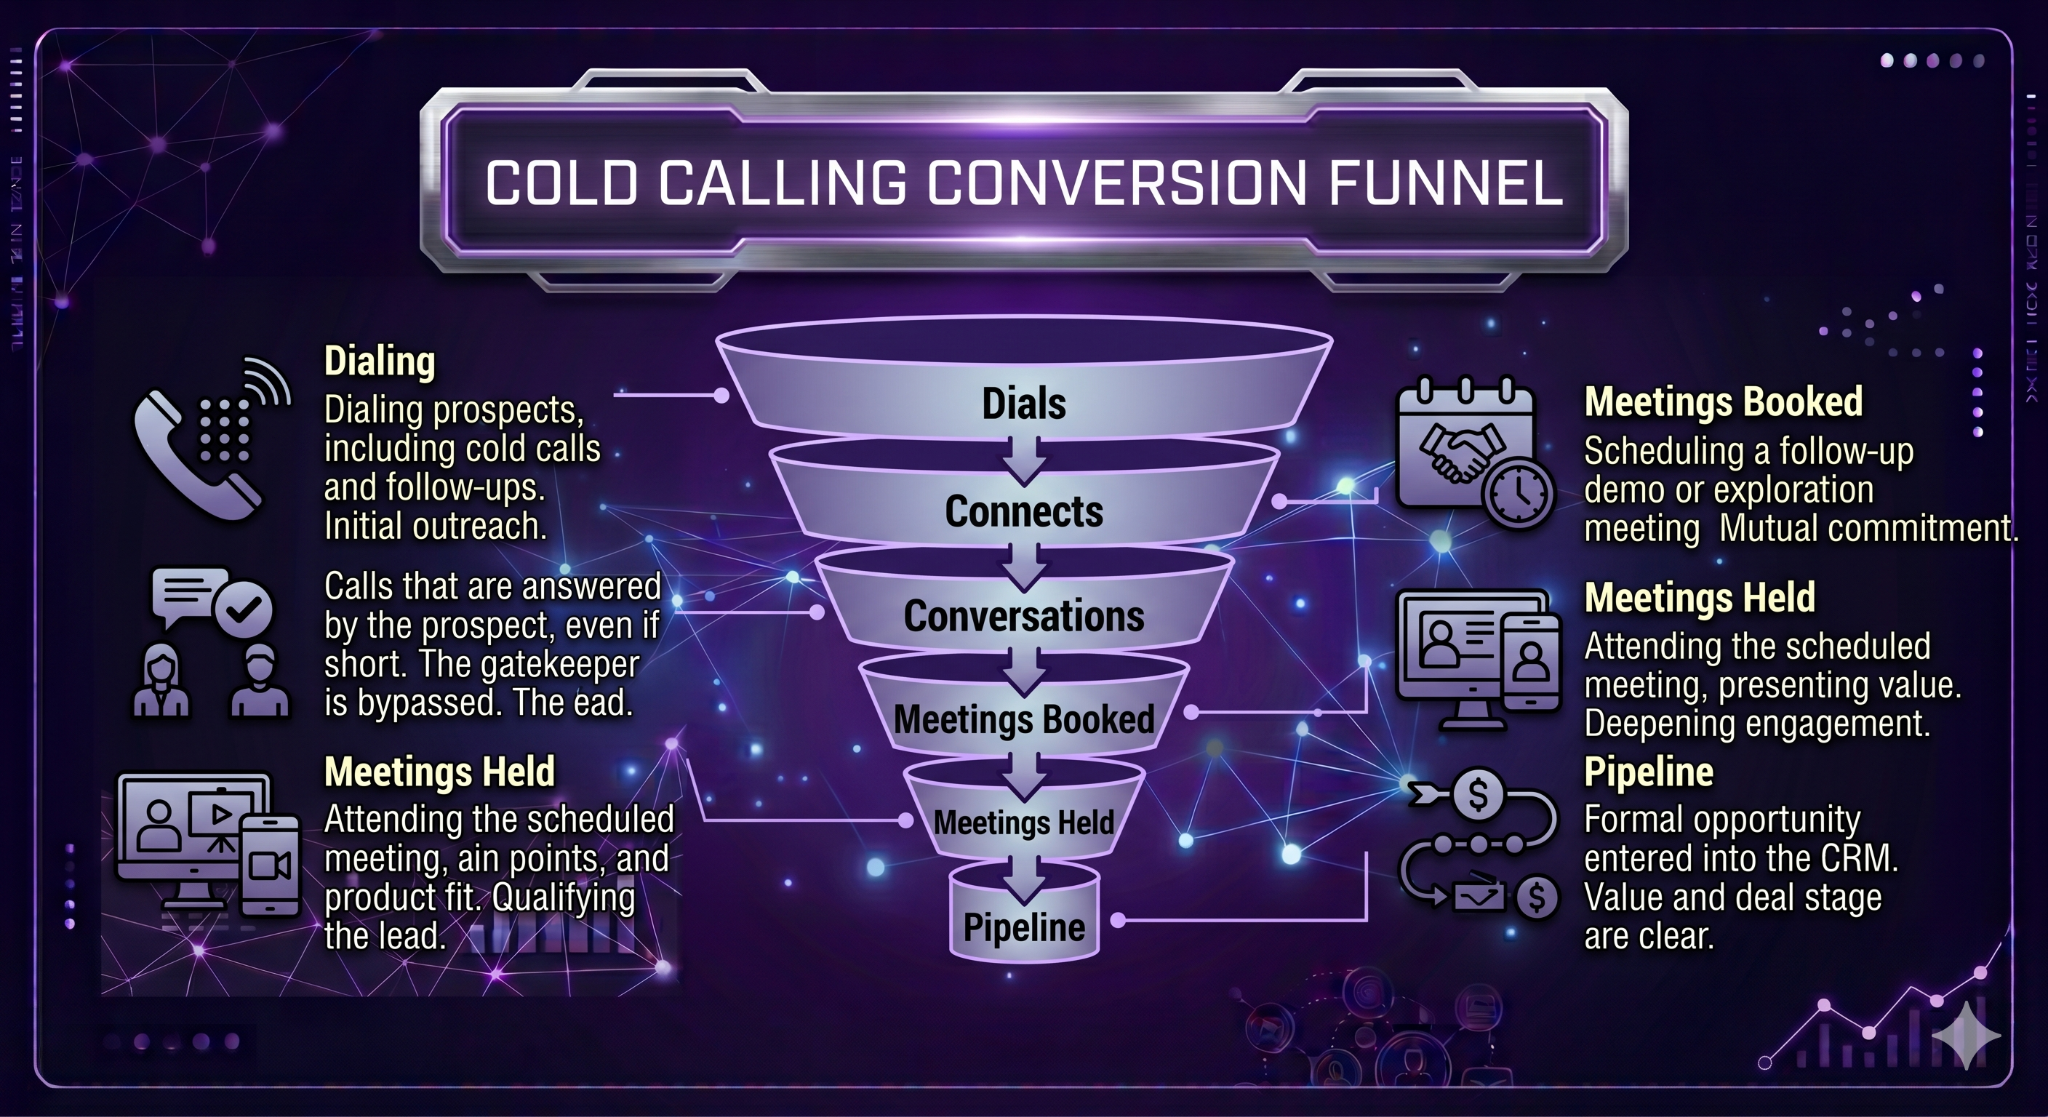
Each metric lives at one transition in that funnel. Fix the right stage and the entire output downstream improves. That's the framework we're building around.
📞 Track Less. Book More Calls.
We handle cold calling end-to-end with trained SDRs. 10–30 qualified meetings every month. Guaranteed.
The 8 Cold Calling Metrics You Must Be Tracking in 2026
Each of these cold calling metrics to track maps to a specific stage in the funnel. The goal isn't to optimize all 8 at once — it's to identify which stage is breaking and fix that first.
1. Dial-to-Connect Rate
Definition: The percentage of dials that result in a live conversation with a prospect.
How to calculate it: (Live connects ÷ total dials) × 100
This is the first filter in your funnel. If you're dialing 100 people and only 3 are picking up, nothing downstream matters — you don't have enough conversations to generate meetings.
Industry average US B2B connect rate sits at 8–12% on generic contact lists, with top performers hitting 25%+ by combining verified data with disciplined timing and clean caller ID hygiene.
A low connect rate is almost never a rep skill problem. The usual causes:
- Stale data — contact moved roles, number changed, or line disconnected
- Flagged caller ID — your number is showing as "Spam Likely" before the prospect even decides whether to answer
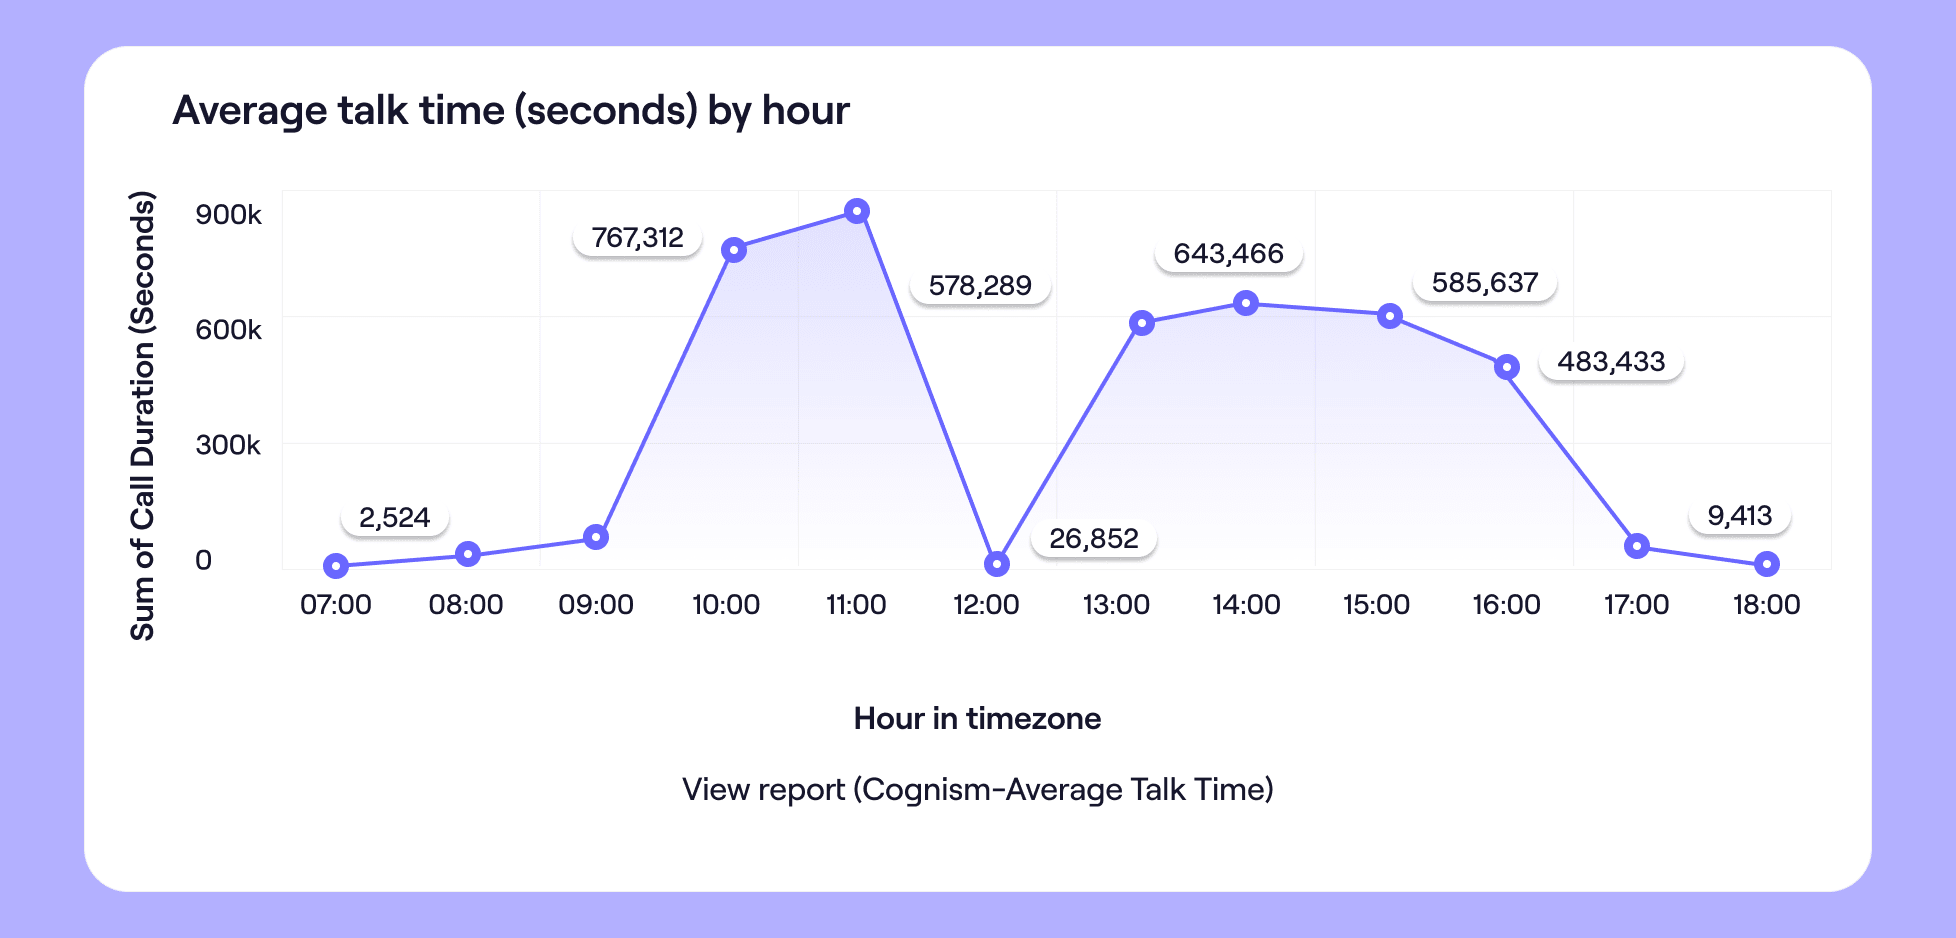
- Wrong timing — calling outside peak windows (10–11 AM and 2–3 PM in the prospect's timezone)
- Wrong persona — calling C-suite contacts who are notoriously hard to reach vs. Directors and VPs
Fix the data and the caller ID before coaching the rep.

2. Connect-to-Conversation Rate
Definition: Of the calls that connect, how many result in a real qualifying conversation — at least 60–90 seconds, with at least one substantive data point captured.
Not all connects are conversations. A gatekeeper who puts you on hold for two minutes and hangs up is a connect. A prospect who says "not interested" before you finish your opener is a connect. Neither counts as a conversation.
The qualified conversation rate — once you actually get someone on the phone — sits at 65.6% when reps execute well. That's the number managers should be coaching against, since it isolates rep skill from data quality.
If your connect-to-conversation rate is well below 65%, the issues to investigate are:
- Weak opener — you're losing prospects in the first 10 seconds
- Poor positioning — the value frame isn't landing for the persona you're calling
- Wrong persona targeting — you're connecting with the right title but the wrong buyer
This is the metric where rep coaching actually applies. Unlike connect rate, which is infrastructure-driven, conversation rate is skill-driven.
3. Conversation-to-Meeting Rate
Definition: The percentage of quality conversations that result in a booked meeting.
This is the most important coaching metric in your entire cold calling metrics KPI stack. It tells you how effective your reps are at converting genuine interest into a calendared commitment.
Average reps convert at around 4.6% from conversation to meeting, while top performers hit 16.7% — a gap almost entirely explained by offer clarity, script strength, and objection handling. Sales So
What drives conversion-to-meeting rate up:
- Offer clarity — the prospect understands exactly what the meeting is for and what they'll get from it.
- Specific next steps — reps who end with "let me send you a calendar invite right now" outperform reps who leave it open.
- Objection handling — the difference between a weak rep and a top performer is almost always how they handle the three most common objections.
When your connect rate looks fine but your meeting volume is low, this is the metric to audit. Pull call recordings for reps with low conversation-to-meeting rates and you'll find the pattern within 10 recordings.

4. Meeting Held Rate
Definition: The percentage of booked meetings that actually happen.
This one gets missed more often than it should. Teams celebrate the booked meeting and forget to track whether the prospect showed up.
A low meeting held rate is a quality signal, not a scheduling problem. It usually means your reps are booking meetings before the prospect is genuinely sold on the conversation. The prospect agreed just to get off the phone — and then no-showed.
Healthy meeting held rates for outbound-sourced meetings run at 70–80%. Below 60% is a red flag worth addressing immediately.
How to improve hold rates:
- Send a confirmation email within 5 minutes of booking — include the agenda and a one-line recap of why the meeting matters to them.
- Add a LinkedIn connection request post-call as a secondary touchpoint.
- Send a reminder the morning of with something of value (a relevant case study, a stat relevant to their business).
The multi-channel follow-up isn't just courtesy. It reinforces the meeting's value and makes it harder for the prospect to rationalize skipping.
5. Average Call Duration
Definition: The average length of connected calls, measured in seconds.
Call duration is a proxy for engagement quality. Short calls — under 60 seconds — are almost always not real conversations. Long calls — 3 to 5 minutes — are where meetings get booked.
In 2026, the average cold call lasts 82 seconds, slightly down from 93 seconds in 2025, suggesting that reps are getting to the point quicker — or that prospects are cutting calls shorter.
How to use duration data for coaching:
- Under 60 seconds average: Your opener isn't creating enough curiosity. The prospect isn't staying on the call long enough to hear the value.
- 60–120 seconds: You're getting past the opener but not building enough momentum. Work on your bridge from opener to discovery question.
- 2–3 minutes: Healthy range. Prospects are engaging. The goal is to push conversations into the 3–5 minute range where conversion rates are highest.
Pull duration data by rep and by list segment. If durations are consistently short for a specific persona or vertical, the problem is likely message-market fit — not rep skill.
6. Attempts-to-Connect Rate
Definition: How many dial attempts it takes to reach a prospect in a live conversation.
This is one of the most misunderstood core cold calling metrics — and the source of one of the most common mistakes in cold calling: giving up too early.
With just 1.55 calls now needed on average to reach a prospect who is likely to answer, the game is getting sharper and more tactical in 2026. But here's the catch — that stat applies to prospects who will eventually answer. Most reps never know who those prospects are until they've attempted enough times.
44% of reps quit after a single follow-up attempt, while 80% of sales require five or more follow-ups to close. The math doesn't work in favor of reps who give up early.
The practical targeting framework:
- Attempts 1–3: Calling during peak windows (10–11 AM, 2–3 PM)
- Attempts 4–6: Mix in early morning and end-of-day calls to vary the pattern
- Attempt 7+: Consider a different channel — add an email or LinkedIn touchpoint before the next dial
6–9 attempts is the range where you capture the vast majority of prospects who will eventually connect. Build that into your sequence before marking a contact as exhausted.
7. Caller ID Health / Number Reputation Score
Definition: A measure of whether your outbound phone numbers are being flagged as spam by carrier analytics systems.
This is the most underrated metric in your entire cold calling KPIs stack — and in 2026, it might be more impactful than any other single variable.
Once a number gets labeled "Spam Likely," more than 95% of those calls go unanswered. B2B contact data decays at roughly 2.1% per month, and carrier spam filtering systems flag outbound callers based on volume spikes and average call duration under 30 seconds.
According to a recent industry report, 81% of businesses have lost revenue due to their calls being incorrectly flagged as spam — and 15% of those businesses lost over $100,000.
Think about caller ID health the same way you think about email deliverability. It's an infrastructure metric, not a sales metric. If your number is flagged, no amount of script improvement or coaching will fix your connect rate.
How to monitor and protect caller ID health:
- Use tools like Free Caller Registry, Hiya Connect, or Kixie's reputation monitoring to check number health weekly.
- Cap dials per number at 50–70 per day — above that, carrier analytics engines start flagging you.
- Rotate numbers proactively, not reactively — don't wait until a number is flagged before replacing it.
- Registered numbers with STIR/SHAKEN attestation and branded caller ID can lift connect rate by 30–60% depending on current state.
If you're seeing connect rates below 5% despite a clean list and good timing, check your numbers first. The infrastructure may be broken before a single rep picks up the phone.

8. Pipeline Generated per SDR
Definition: Total qualified pipeline value attributed to cold calling activity per rep, over a given period.
This is the only cold calling metrics KPI that ties everything above directly to revenue. Every other metric on this list is a leading indicator — pipeline per SDR is the outcome.
How to calculate it: Sum of the deal values of all opportunities opened by a rep through cold calling outreach over a defined period (monthly or quarterly).
Why it matters so much:
- A rep with a strong dial-to-connect rate but a weak offer isn't generating pipeline — you'll see it here.
- A rep booking lots of meetings but with low-quality prospects will show low pipeline per SDR even with high meeting numbers.
- It's the metric that justifies (or questions) cold calling investment in your board deck.
When pipeline per SDR is consistently low across the team, the problem is usually structural — bad list quality, unclear ICP, or a value proposition that's not resonating. When it's low for one rep but healthy for others, it's a coaching problem.
Connect this metric back upstream. If SDR A generates $400K in pipeline and SDR B generates $90K with similar call volumes, run both of their funnels through the metrics above. The gap will be visible in one or two of the earlier stages.
How to Use These Metrics to Build a Cold Calling Improvement System
Segment Before You Diagnose
Aggregate metrics lie. The most powerful thing you can do with your cold calling metrics to track is segment them before drawing any conclusions.
Break your metrics down by:
- List source — are connect rates higher on Apollo data vs. ZoomInfo vs. Clay-enriched lists?
- Persona — are VPs converting at a different rate than Directors? Are certain verticals dead zones?
- Rep — is the low conversation-to-meeting rate a team problem or a one-rep problem?
SDRs spend just 2 hours per day actively selling, with the rest lost to administrative tasks and research. Segmented metrics tell you exactly where to direct the limited time reps actually spend selling.
Build a Review Cadence
Not all metrics need the same review frequency. Here's a practical cadence:
- Daily: Dial volume, connects, conversations — catch short-term anomalies fast
- Weekly: Connect rate, conversation-to-meeting rate, meeting held rate, caller ID health — enough sample size to be meaningful, frequent enough to catch issues before they compound
- Monthly: Pipeline per SDR, attempts-to-connect, average call duration trends — used for strategic decisions about list quality, script revision, and rep development
Fix the Funnel From the Top Down
When you're looking at multiple metrics that are all underperforming, prioritize fixes in funnel order. There's no point optimizing your conversation-to-meeting rate if 3% of your dials are even connecting.
Fix connect rate first. Then conversation rate. Then conversion to meeting. Then hold rate. Work downstream only after the upstream stage is healthy.
🚀 Metrics Matter. Execution Wins.
1M+ calls made. 53K+ appointments set. We fill your calendar—you focus on closing.
How Cleverly Tracks and Optimizes Cold Calling Performance for B2B Clients
Most cold calling programs are built around one number: dials made. Cleverly's are built around the full funnel.
Our cold calling services are metric-driven from day one. Before an SDR makes a single call, we've verified the list against ICP parameters, checked for data freshness, and ensured caller IDs are clean and properly registered. Connect rate problems are infrastructure problems — we fix them before launch, not after a week of burned calls.
Every SDR on our team is coached using conversation-to-meeting rate and call duration data — not dials. That means when a rep's numbers slip, we can trace it to a specific stage in the funnel and correct it quickly. Script iterations, opener testing, and objection-handling coaching are all driven by what the data shows, not intuition.
Our clients see faster ramp times because the feedback loop is already built in. Metrics surface the problem. The process corrects it. The list gets refined. And the results compound.
Results we've driven:
- $312M in pipeline generated for 10,000+ B2B clients
- 53K+ appointments set across cold calling campaigns
- 1M+ cold calls made — with guaranteed appointments or we replace the SDR
- SDRs trained and campaign-ready in 2 weeks
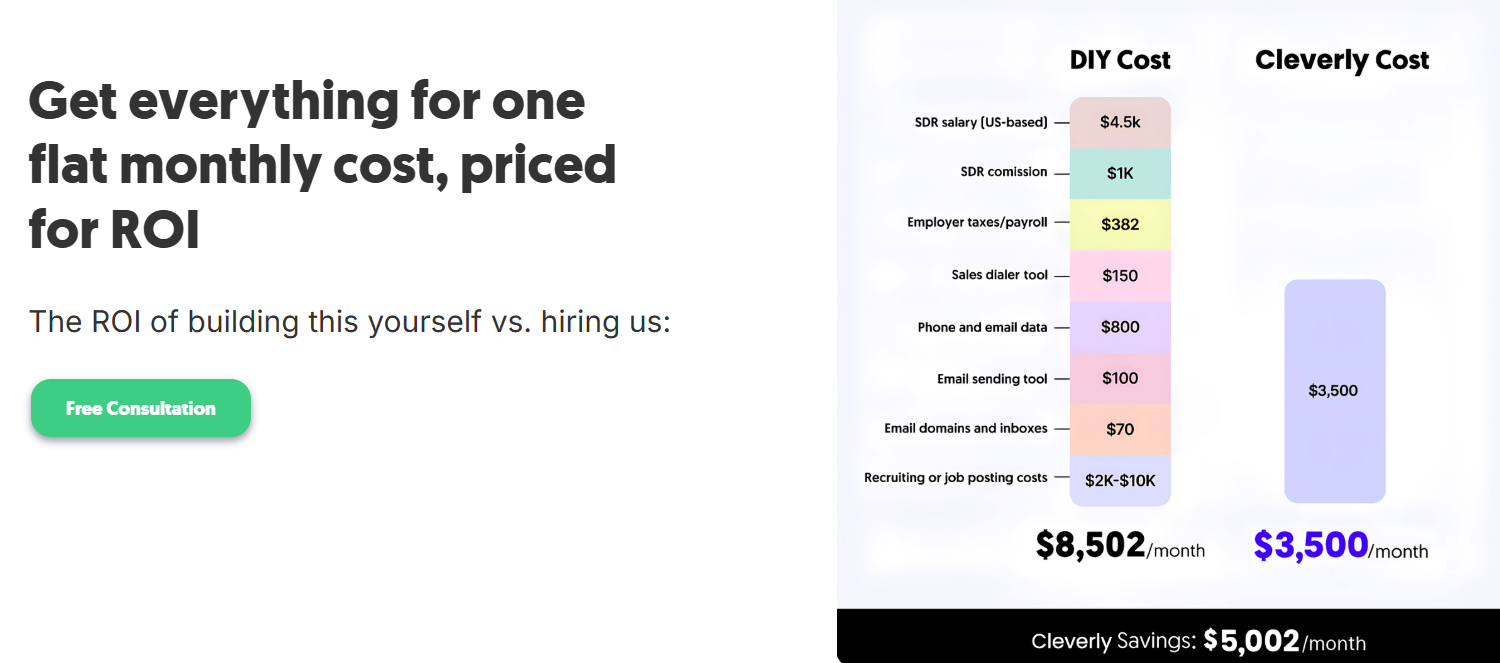
- Half the cost of building an in-house SDR team
Want a cold calling program that's built around performance metrics — not just dials?
🔥 Book a free strategy call with Cleverly and we'll show you exactly how we'd approach your outbound!
Conclusion
The teams winning in 2026 aren't the ones making the most calls — they're the ones measuring the right things and knowing what to fix when numbers fall short.
Each of the 8 cold calling metrics in this guide maps to a specific problem: data quality, infrastructure, script strength, conversation quality, or process. Start with dial-to-connect rate and conversation-to-meeting rate if you're only building two dashboards. Build the review cadence. Run the segmentation.
And treat your cold calling funnel the way top-performing teams do — as a system you optimize, not just a volume game you play.
Frequently Asked Questions
Free Resource
How to Scale a Profitable Cold Call System
Get the complete guide — download it instantly now.
Free Ebook
Download the Free Guide
Enter your details to get instant access.
You're all set! 🎉
Your ebook is downloading now.
Click below if the download didn't start automatically.