Table of Contents
Why ABM Requires a Different Measurement Framework
The ABM Metrics Framework: Four Layers to Measure
ABM Metrics to Track: The Ones That Actually Matter
ABM Metrics to Ignore: Vanity Metrics That Mislead
ABM Benchmarks: What Good Looks Like
How to Build an ABM Reporting Structure That Earns Leadership Trust
ABM Metrics by Tier: What to Prioritize at Each Level
Common ABM Measurement Mistakes to Avoid
How Cleverly Helps B2B Teams Generate the Pipeline ABM Metrics Are Built to Prove
Conclusion
Frequently Asked Questions
Modified On :
July 9, 2026
Key Takeaways
- Stop measuring ABM with lead-gen metrics. Account penetration, buying committee coverage, and pipeline generated tell you what's actually happening — MQL count and impressions don't.
- ABM moves through four stages: Coverage, Engagement, Pipeline, and Revenue. Know which stage you're measuring or your reporting will confuse everyone in the room.
- Drop total MQL count, ad impressions, email open rate, and generic website traffic from your dashboard. They measure activity, not buying behavior.
- Report differently by audience. Weekly for the team to act on, monthly for marketing and sales leaders to optimize, quarterly for execs to fund. One dashboard for all three doesn't work.
- If you're starting from zero, track three things: account engagement score, pipeline generated from target accounts, and win rate vs. non-ABM accounts. That covers Coverage, Pipeline, and Revenue.
Only about half of companies running ABM programs actually measure the ROI, and among those who try, nearly half say proving that ROI is their single biggest challenge. That's not because ABM doesn't work.
The average ABM program returns 137% ROI, and companies running ABM well see win rates jump 35% or higher against non-targeted accounts. The problem is almost always the measurement, not the strategy.
Here's what usually happens: a team launches ABM, then grades it with the same scorecard they used for demand gen. Thirty days in, MQL count looks weak, impressions look thin, and someone in a budget meeting calls the whole thing a failure.
Meanwhile, the accounts that actually mattered are still three months from closing and were never going to show up as MQLs in the first place.
This guide breaks down the ABM metrics that actually predict revenue, the ones worth dropping entirely, and how to build a reporting structure that gets ABM funded instead of questioned.
If you're a program manager, demand gen lead, or revenue leader trying to prove account-based work is paying off, this is your framework.
Why ABM Requires a Different Measurement Framework
ABM is an account-level strategy. Full stop. That means your measurement has to reflect what's happening at the account level, not what one person did on one Tuesday.
A single MQL from a target account tells you almost nothing. Maybe it's the economic buyer downloading a pricing guide. Maybe it's an intern filling out a form to get a free ebook. Same metric, completely different meaning.
This is the core issue with applying ABM campaign metrics borrowed from demand gen: they were never built to distinguish between the two.
The shift from lead-based to account-based thinking
Instead of asking "how many leads did we generate this month," ask:
- How many target accounts are actively engaged right now?
- How many of those have entered the active pipeline?
- How fast are they moving toward close compared to accounts we didn't target?
That's a completely different conversation, and it's the one your leadership actually cares about.
The four-stage progression every ABM program moves through
- Coverage — Are we even reaching target accounts?
- Engagement — Are those accounts interacting with us?
- Pipeline — Are engaged accounts converting into active deals?
- Revenue — Are ABM accounts winning and retaining at a higher rate?
Most programs get judged at stage 1 using stage 4 expectations. That mismatch is why so many ABM programs get shut down at month two, right before they would've started proving out.
Pro tip: Teams that review account engagement scores weekly close deals roughly 30% faster than teams reviewing monthly. Measurement frequency isn't a nice-to-have here. It changes outcomes.
🎯 Target Fewer Accounts. Close Bigger Deals.
We help B2B teams reach decision-makers through LinkedIn, cold email, and cold calling to generate 15–30 qualified meetings every month.
The ABM Metrics Framework: Four Layers to Measure
Use this to structure your dashboard so every stakeholder sees what's relevant to them and nothing else.
If your current reporting shows one blended dashboard to all four groups, that's probably part of why it isn't landing. A CFO doesn't want to see engagement scores. An SDR doesn't need quarterly ROI math.
ABM Metrics to Track: The Ones That Actually Matter
These are the ABM metrics to track if you want numbers that predict revenue instead of just looking busy.
1. Account Penetration Rate

This is the percentage of target accounts where at least one contact has engaged, whether that's a reply, a click, an event attendance, or a website visit.
Why it matters: If you can't reach target accounts at all, nothing else on this list matters. Penetration is the floor. Fix it before you optimize anything downstream.
How to calculate it: Number of target accounts with 1+ engaged contact ÷ Total target accounts × 100
Benchmark: 60%+ penetration within 90 days of launch is healthy.
If you're below 40%, the contact data is probably wrong, you're not reaching actual buying committee members, or the messaging isn't landing. This is usually where we start when we're building outreach for a client's ABM motion. Bad data kills penetration before the campaign even gets a fair shot.
2. Buying Committee Coverage
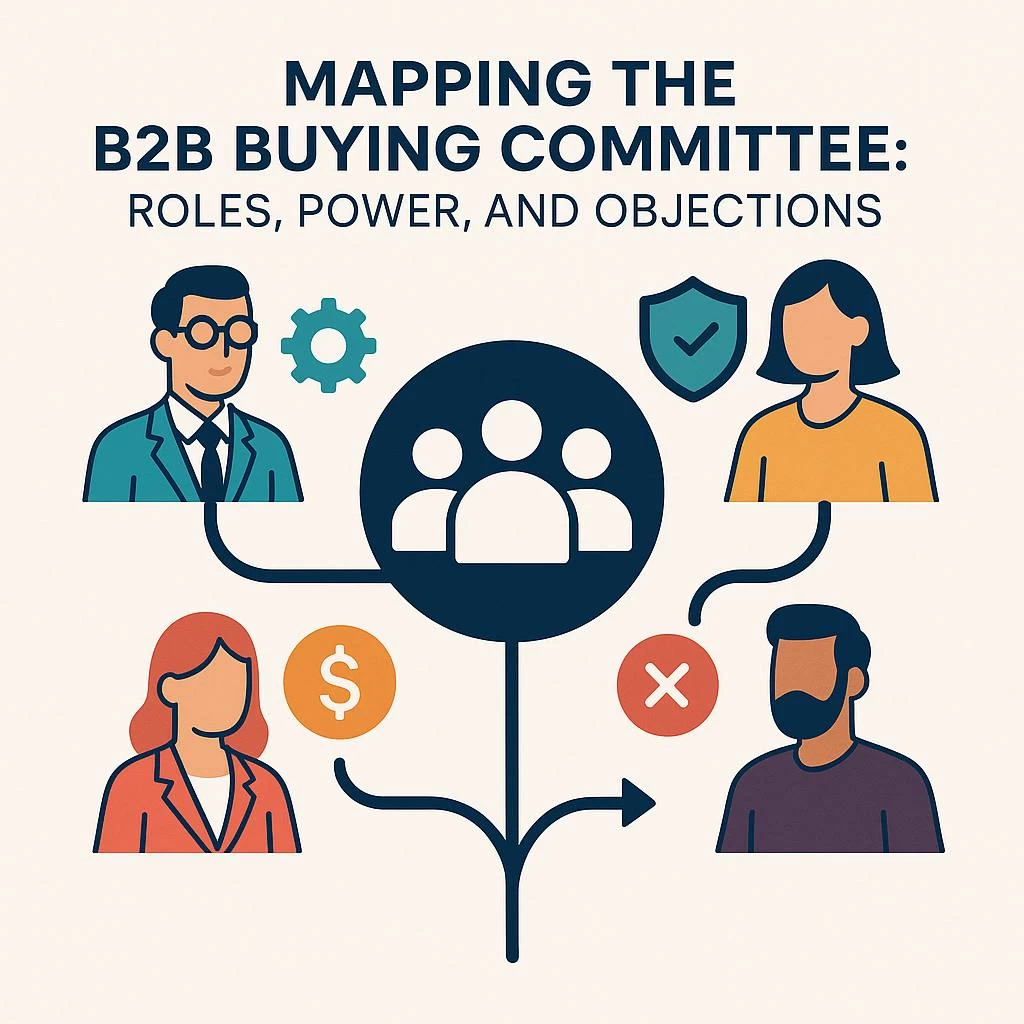
The average number of buying committee members engaged per target account.
Why it matters: B2B deals involve 6 to 10 stakeholders on average. If your engagement is concentrated on one champion, the deal stalls the moment it hits someone else on the committee who's never heard of you.
Benchmark: 3+ engaged buying committee members per Tier 1 account before you move an opportunity into active pipeline.
Low coverage here almost always means outreach is hitting the same job title over and over instead of multi-threading across roles. If your ABM success metrics show good penetration but weak coverage, that's your signal to diversify who you're targeting inside each account.
3. Account Engagement Score

A composite score pulling together every touchpoint an account has with your brand: site visits, content downloads, ad clicks, email replies, event attendance, demo requests.
Why it matters: This is your prioritization list. It tells you which accounts are heating up right now and which are going cold and need a push.
Weighting tip: Explicit actions (demo request, pricing page visit, direct reply) should count more than implicit ones (email open, blog visit). Recent activity should outweigh activity from 60 days ago.
Benchmark: Accounts in the top 25% of engagement scores should convert to pipeline at 2-3x the rate of low-engagement accounts. If they're not, your weighting is off and worth recalibrating.
Operational tip: Review scores weekly in a joint sales-marketing meeting. Any account crossing your threshold should trigger SDR or AE follow-up within 24 hours. A score nobody acts on is just a number sitting in a dashboard.
4. Target Account Pipeline Generated
The total value of pipeline sourced from or influenced by your ABM program.
Why it matters: This is the metric that connects ABM spend to revenue potential. It's the one number that gets a CRO's attention in a budget review.
How to calculate it: Sum the value of open opportunities where the account is on your target list. Separate marketing-sourced (first touch came from an ABM channel) from marketing-influenced (ABM touched the account during an already-sourced deal).
Benchmark: Target accounts should generate pipeline at 2-5x the rate of similar non-targeted accounts. A healthy program produces $5 to $15 of pipeline for every $1 spent in year one.
5. Pipeline Velocity From Target Accounts
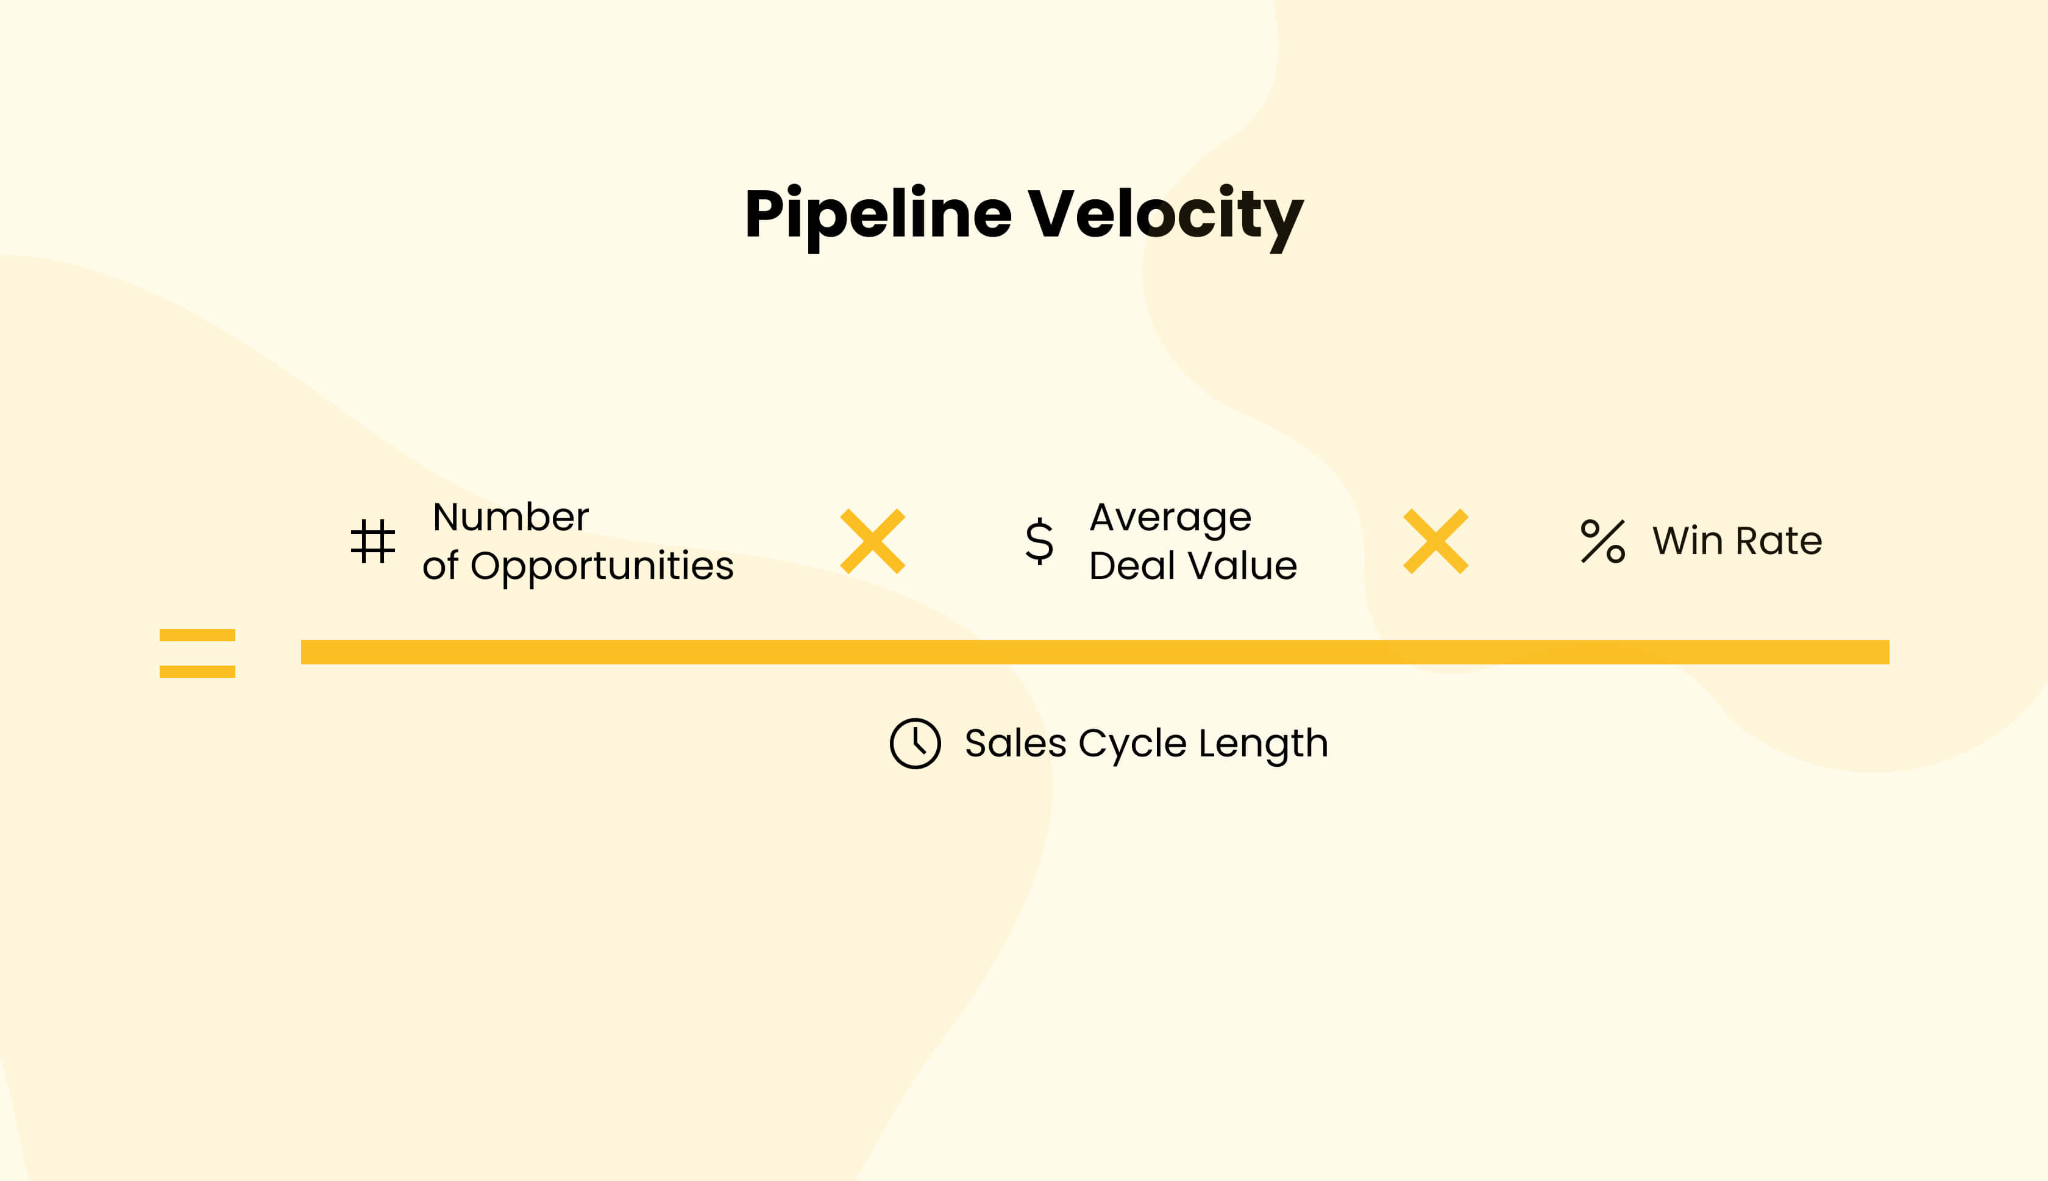
The speed target accounts move through your pipeline compared to non-ABM accounts of similar size.
Why it matters: This is proof that multi-stakeholder engagement is actually accelerating deals, not just running in parallel with them.
Benchmark: Well-run ABM programs cut pipeline velocity by 20-40% versus non-ABM accounts.
If your ABM accounts move at the same pace as everything else, your buying committee coverage is probably too thin, or your content is reaching people too late to shape their decision.
6. Account Win Rate
The percentage of ABM-targeted opportunities that close won, compared to non-targeted accounts with similar firmographics.
Benchmark: 35% higher win rates from targeted accounts is the mark of a well-run program. Under 15% and your ICP definition or buying committee mapping needs a second look.
Tracking tip: Tag opportunities in your CRM by ABM tier (1, 2, 3) so you can compare win rates by tier every quarter instead of guessing.
7. Marketing-Influenced Revenue
The total closed-won revenue from accounts where marketing touched the buying committee at any point, first-touch or supporting.
Why it matters: This is the number CFOs and CEOs actually understand. Everything else on this list is a leading indicator. This is the one that shows up on the income statement.
ROI formula: ([ABM-Generated Revenue − ABM Program Cost] ÷ ABM Program Cost) × 100
A well-run program hits 300-500% ROI within 18-24 months, though the average across broader survey data lands closer to 137%, so treat the higher end as what strong execution can produce, not the baseline.
One nuance to flag in your reporting: marketing-sourced (marketing got the first touch) and marketing-influenced (sales sourced it, marketing engaged the committee) are different stories. Report both, and don't let them blend into one vague number.
🚀 ABM Works Best With Multi-Channel Outbound
Join 10,000+ companies using Cleverly to turn high-value target accounts into predictable pipeline and revenue.
ABM Metrics to Ignore: Vanity Metrics That Mislead
These feel like progress. They aren't. Tracking them next to your real ABM metrics dilutes your reporting and pushes you toward the wrong decisions.
Total MQL Count From Target Accounts
MQL volume is the default demand gen metric, which is exactly why it doesn't belong here. A form fill from a junior employee registers the same as one from a decision-maker. Programs that optimize for MQL volume from target accounts end up chasing the wrong contacts entirely.
Track instead: buying committee coverage and account engagement score.
Total Ad Impressions Served to Target Accounts
Easy to pull, means almost nothing. Ten thousand impressions doesn't tell you if anyone read the ad, remembered it, or changed how they think about buying.
Track instead: engagement score changes attributed to paid channels specifically.
Email Open Rate From ABM Sequences
Open rate is an attention metric, not an engagement one. Four contacts opening an email with zero replies isn't a warm account, it's a curious one. And in 2026, Apple Mail Privacy Protection has made open rate borderline unreliable as a signal anyway.
Track instead: reply rate, positive reply rate, and meetings booked.
Website Traffic From Target Accounts
Tools like Demandbase or RB2B can show you which accounts are hitting your site, and it feels like a hot signal. It usually isn't. A blog visit from someone at a target account doesn't indicate intent on its own.
Track instead: high-intent page visits (pricing, comparison, demo, case study pages) from buying committee contacts specifically. Generic traffic is noise.
ABM Benchmarks: What Good Looks Like
Use this to diagnose, not to panic.
How to Build an ABM Reporting Structure That Earns Leadership Trust
What gets measured gets funded. Reporting that speaks in pipeline and revenue keeps ABM alive through budget season. Reporting that leads with impressions and open rates gets questioned every single time.
✅ Weekly ABM Report (Sales + Marketing)
Who sees it: SDRs, AEs, demand gen manager, ABM lead
What's in it: accounts with engagement score changes, new accounts crossing the follow-up threshold, buying committee contacts added this week, accounts going cold.
Format: a shared CRM dashboard or a quick email. Not a slide deck. This report exists to trigger action, not to look polished.
✅ Monthly ABM Report (Marketing + Sales Leadership)
Who sees it: VP Marketing, VP Sales, demand gen director, ABM lead
What's in it: account penetration vs. target, buying committee coverage by tier, new pipeline generated, pipeline velocity comparison, top 5 engaged accounts, channel performance breakdown.
Format: a one-page dashboard. Lead with pipeline, then engagement, then channel data.
✅ Quarterly ABM Report (Executive / Board Level)
Who sees it: CEO, CFO, CRO, board
What's in it: total pipeline generated (quarter and cumulative), ABM vs. non-ABM win rate, marketing-influenced closed-won revenue, ROI calculation, velocity improvement, account list health.
Format: executive summary, then 3-5 metrics with quarter-over-quarter trend. Every line should answer one question: is this working, and should we invest more?
ABM Metrics by Tier: What to Prioritize at Each Level
Not every metric deserves the same attention at every tier. Match measurement intensity to investment intensity.
Common ABM Measurement Mistakes to Avoid
❌ Measuring too early. ABM needs 3-6 months for real engagement signals and 12-18 months for full pipeline impact. Judging it on 30-day lead counts is the single most common reason programs get killed before they had a chance to work.
❌ Using single-touch attribution. First-touch and last-touch both misrepresent ABM's contribution. Multi-touch attribution across the buying committee is the only version that tells the truth.
❌ Tracking metrics without acting on them. An engagement score nobody reviews weekly is just a number sitting in a system. It only has value if it triggers follow-up.
❌ Reporting in marketing language to executives. Impressions and open rates in front of a CFO guarantee skepticism. Translate everything into pipeline and revenue before it reaches that layer.
❌ Not tagging ABM accounts in CRM. Without clean tagging from day one, win rate and velocity comparisons are impossible to run later. Set this up before the first campaign launches.
How Cleverly Helps B2B Teams Generate the Pipeline ABM Metrics Are Built to Prove
Every metric in this guide comes down to one thing: whether your ABM program is creating real buying committee engagement that turns into pipeline. And the biggest driver of that engagement is direct outreach to the right people at the right accounts, consistently.
That's the layer we handle. We do the ICP-targeted research across buying committee roles, run personalized outreach across LinkedIn and cold email, and book qualified meetings with decision-makers at target accounts.
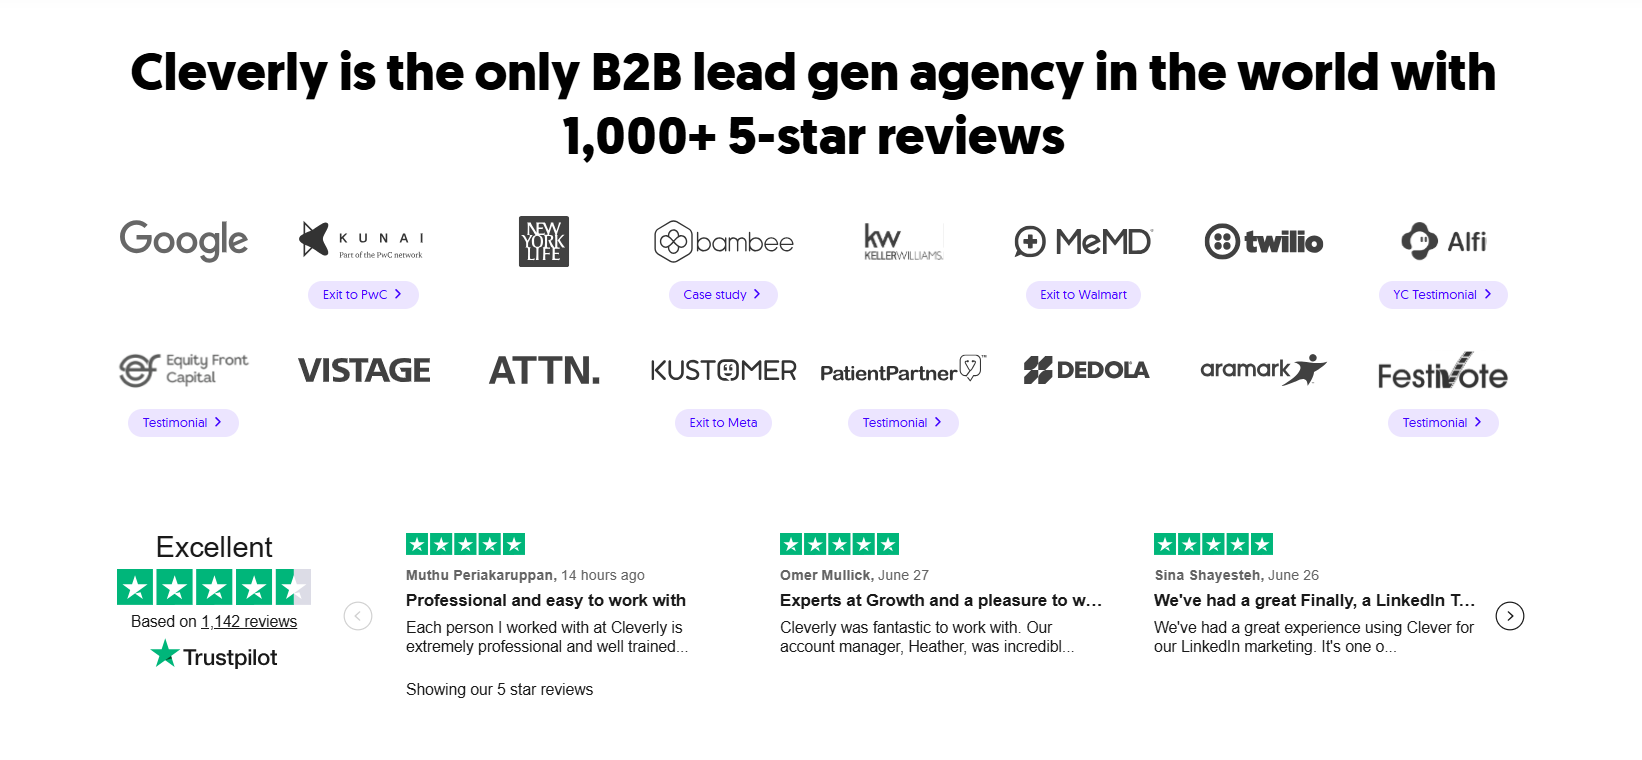
We've done this for over 10,000 B2B companies, generating $312M in pipeline for clients along the way.
The reason this connects directly to your ABM dashboard: our outreach drives account penetration (more accounts reached), buying committee coverage (multiple roles engaged per account, not just one), and pipeline generated (meetings that turn into real opportunities). It's the input side of every metric on this page.
Most teams don't build this in-house because it means hiring SDRs, buying data, writing sequences, and managing follow-up on top of everything else on the roadmap. We run that end-to-end so your team can stay focused on strategy and closing.
If you want the outreach layer that actually feeds your ABM pipeline numbers, book a strategy call and we'll walk through what that looks like for your target accounts.

Conclusion
ABM metrics aren't complicated once you stop trying to force lead-based thinking onto an account-based motion. The shift is deliberate: measure accounts, not individual actions, and the programs that make that switch consistently outperform the ones that don't.
Seven metrics tell the real story here: account penetration, buying committee coverage, account engagement score, pipeline generated, pipeline velocity, win rate, and marketing-influenced revenue. Everything else, including MQL count, impressions, and open rates, is activity dressed up as progress.
If your reporting doesn't exist yet, start with three: engagement score, pipeline generated, and win rate vs. non-ABM accounts. That's enough to prove the program is working while you build out the rest.
Frequently Asked Questions
Free Resource
How to Scale a Profitable Cold Call System
Get the complete guide — download it instantly now.
Free Ebook
Download the Free Guide
Enter your details to get instant access.
You're all set! 🎉
Your ebook is downloading now.
Click below if the download didn't start automatically.