
Table of Contents
Why Most Lead Generation Reports Miss the Mark with CEOs
What Metrics to Include in a Lead Generation Report for Your CEO
How to Structure a Lead Generation Report Your CEO Will Actually Read
Lead Generation Report Cadence — Weekly, Monthly, and Quarterly
Lead Generation Report Template — What to Include
How to Build a Lead Generation Report When You Don't Have All the Data
How Cleverly Makes Lead Generation Easy to Report On
Conclusion
Frequently Asked Questions
Modified On :
June 11, 2026
Key Takeaways
- A CEO-ready lead generation report leads with pipeline and ROI — not MQL volume, impressions, or traffic data.
- The five metrics that matter most at the executive level: pipeline generated, revenue influenced, cost per qualified lead, cost per opportunity, and pipeline coverage ratio.
- Structure your report in five sections: executive summary, pipeline dashboard, channel performance breakdown, wins and misses, and next period priorities.
- Run three reporting cadences: weekly for internal execution, monthly for CEO visibility, quarterly for budget decisions.
- You don't need perfect attribution to start reporting — a transparent, data-honest report builds more credibility than silence.
Your lead generation report is either making the case for your budget or quietly eroding it. There's rarely a middle ground.
The problem most marketing and demand gen teams run into isn't bad data. It's that they're answering questions the CEO never asked. Nobody in the boardroom is sitting around wondering how many impressions your last campaign drove. What they want to know is what it cost, what it produced in the pipeline, and whether it's worth doing more of.
The median B2B cost-per-lead hit $213 in 2026, per HubSpot's State of Marketing report — up from $198 in 2025. At that price point, every lead generation dollar has to tell a story. And yet most reporting still leads with vanity metrics that make marketing look busy without making the case for marketing being valuable.
More than a third of marketers face internal pressure to deliver MQL volume regardless of quality — which means the reporting problem compounds the strategy problem. When you optimize for the wrong KPI and then report on it, you lose twice.
This guide is for marketing leaders, demand gen managers, and RevOps professionals who need to build a lead generation report that actually lands with a CEO. We'll cover what metrics to include, how to structure the report, what cadence to follow, and a template you can use right now.
Why Most Lead Generation Reports Miss the Mark with CEOs
The fundamental disconnect in lead generation reporting comes down to training. Marketing teams are trained to track activity. CEOs are trained to evaluate outcomes. When those two perspectives collide in a monthly report, it usually doesn't go well.
Reporting MQL volume without pipeline attribution doesn't tell a CEO anything useful. It invites the question, "So what?" and rarely has a satisfying answer. Reporting on email open rates or ad impressions is even worse. Those metrics belong in your operational dashboard, not your executive deck.
What CEOs Actually Want to Know
When a CEO opens a lead generation report, they're running through a fast mental checklist:
- What did we spend on lead generation this period?
- What pipeline did it create?
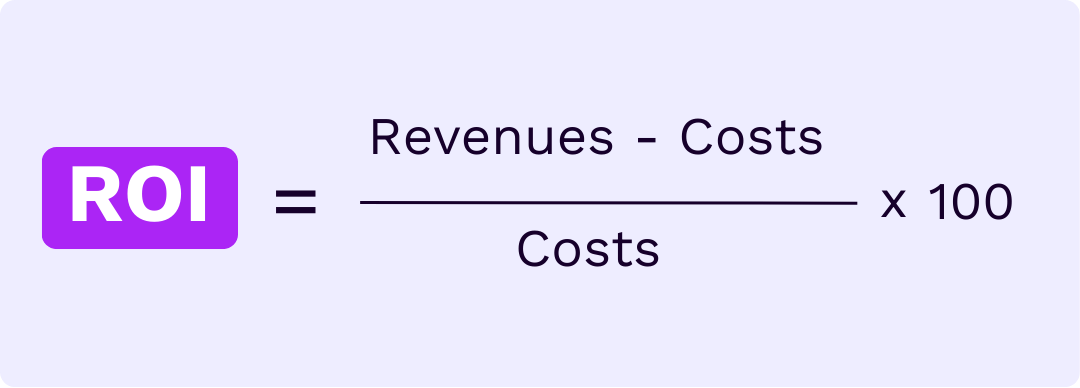
- What's the ROI?
- What's working and what isn't?
- What should we do differently next quarter?
If your report doesn't answer those five questions in the first page, you've already lost the room.
The Attribution Gap
The deeper reason most lead generation reporting fails is attribution. Marketing leaders estimate about 25% of their budget goes to campaigns that look productive in dashboards but don't actually drive revenue.
That's not a strategy problem — that's a measurement problem. When you can't connect campaign spend to pipeline creation, you default to top-of-funnel metrics to justify the budget. And that loop undermines credibility every quarter.
The shift that changes everything is treating your lead generation report like a business case — updated monthly, grounded in revenue data, designed to answer the question leadership is actually asking.
💰 Less Reporting. More Revenue.
Stop explaining missed targets. Start generating predictable meetings with done-for-you outbound. Starting at $397/mo.
What Metrics to Include in a Lead Generation Report for Your CEO
A good B2B lead generation report at the CEO level shows no more than 7–10 metrics total. More than that signals poor prioritization, not thoroughness. The hierarchy matters: always lead with pipeline and revenue impact, follow with efficiency metrics, then add volume and conversion data as supporting context.
Revenue and Pipeline Metrics (Lead With These)

These are the numbers your CEO cares about. Everything else is context.
✅ Pipeline generated is the most important single number in any B2B lead gen report. It's the total value of opportunities created from your lead generation activity in the period. If you only report one metric to your CEO, this is it.
✅ Revenue influenced captures closed-won deals where at least one lead generation touchpoint appears in the attribution path. Pair it with pipeline generated so leadership sees both what you created and what you contributed to closing.
✅ Marketing-sourced vs. marketing-influenced pipeline is a distinction worth making explicit. Sourced means marketing created the lead. Influenced means marketing touched a deal that originated somewhere else. Both numbers matter. CEOs who only see sourced pipeline will undervalue marketing's contribution.
✅ Pipeline coverage ratio tells your CEO whether your pipeline is healthy relative to the revenue target. A 3x coverage ratio is the general benchmark for efficient teams — meaning $1.5M in pipeline for every $500K in quarterly revenue target. The 2026 median has settled at 3.2x; anything below 2.5x is a leading indicator of missed quota one to two quarters out.
✅ Lead-to-revenue conversion rate takes 3–6 months of historical data to measure accurately, but it's one of the most powerful numbers in your report. It's the percentage of leads generated in a given period that eventually converted to closed revenue.
Efficiency Metrics (Cost and ROI)
✅ Cost per lead (CPL) is table stakes. The median B2B CPL sits at $213 across channels in 2026, but the top quartile of programs achieve $84 CPL while the bottom quartile sits at $397 — a 4.7x spread driven by ICP discipline versus volume-chasing. Use those as benchmarks when contextualizing your performance for leadership.
✅ Cost per qualified lead (CPQL) is more meaningful than CPL. It filters out unqualified volume and shows the CEO what it actually costs to produce a meeting-ready lead. If your CPL looks good but your CPQL is through the roof, you have a lead quality problem, not a volume win.
✅ Cost per opportunity (CPO) ties spend directly to pipeline creation. It's total spend divided by qualified opportunities created in the period — the clearest line between your budget and the pipeline it's producing.
✅ Return on marketing investment (ROMI) is the metric that most directly answers "is this worth it?" — revenue attributed to lead generation divided by lead generation spend.
Volume and Funnel Metrics (Context, Not Headlines)
These belong in the report as supporting data, not as the story you lead with.
The MQL-to-SQL conversion median across B2B in 2026 is 13%, while top-quartile teams hit 28%. That 15-point gap is worth including in your CEO report if you're anywhere near the top of that range.
What to leave out of the CEO report entirely: impressions, clicks, open rates, bounce rates, social engagement. Those belong in your operational dashboard, not your executive summary.
How to Structure a Lead Generation Report Your CEO Will Actually Read
CEOs read reports fast. You have roughly 60 seconds to deliver the most important insight before their attention moves on. The structure you use either works for them or against you.
Here's the five-section structure that works across B2B companies at every growth stage:
Section 1 — Executive Summary (1 Page Max)
Three to five bullet points. That's it.
Lead with the outcome in the first sentence: "This month's lead generation activity produced $X in pipeline from Y qualified opportunities at a CPQL of $Z." Everything after that is context.
Flag any material changes from the prior period proactively. CEOs notice anomalies. It's always better to explain a dip before they ask than to be caught reacting to the question. Include one forward-looking sentence about what you expect next month and why.
Section 2 — Pipeline and Revenue Dashboard
A single-view table or chart showing pipeline generated (this period vs. prior period vs. target), revenue influenced, and pipeline coverage ratio. Three columns. Clear status signals.
Include an attribution breakdown: what percentage of pipeline came from each channel. That single row tells your CEO where to invest more and where to pull back — it's one of the most budget-relevant visuals in the entire report.
Always show a rolling 90-day view alongside the current month. One month of data is noise. A quarter of data is a pattern.
Section 3 — Channel Performance Breakdown
For each active channel, show: spend, leads generated, CPL, CPQL, MQL-to-SQL rate, and pipeline contribution.
Rank channels by pipeline contribution — not lead volume. The channel generating the most leads is frequently not the channel generating the most pipeline. That distinction matters a lot when budget decisions come up.
Use a simple three-tier status for each channel:
Don't include channels that have been running for less than 60 days. Incomplete data creates misleading comparisons, and no CEO should be making budget decisions off 30 days of ramp data.
Section 4 — What's Working and What Isn't
This is where the report earns credibility. Two to three specific observations, each with a data point and a recommended action attached.
Good format:
"LinkedIn outbound generated 40% of qualified pipeline this month at a CPQL 28% below our channel average. Recommend increasing outbound volume in Q3."
"Paid search CPL increased 34% MoM — likely driven by competitive bidding pressure. Testing new ad creative and negative keyword updates in progress. Expect CPL to normalize within 6 weeks."
Avoid vague language. "Results were mixed" tells your CEO nothing and makes marketing look like it doesn't understand its own data.
Section 5 — Next Period Priorities and Budget Implications
Three to five priorities for the upcoming period, each with a rationale tied back to performance data from the current report. Any budget reallocation request you make here should be grounded in channel data from Section 3 — that's how you defend existing budget and earn more of it.
Close with a simple forecast: if current channel mix and spend levels continue, what pipeline should the CEO expect next month? A one-line projection with a confidence range is far more useful than a careful disclaimer about data uncertainty.
📈 Want Better Numbers Next Quarter?
Start with more sales conversations today. We fill calendars with qualified prospects while your team closes deals.
Lead Generation Report Cadence — Weekly, Monthly, and Quarterly
Not all lead generation reporting belongs in the same document on the same schedule. Different stakeholders need different views at different frequencies.
Weekly Lead Generation Report
Audience: Marketing team and sales leadership — not the CEO in most cases.
Focus: Activity metrics. Leads generated by channel, MQL volume, SQL conversions, pipeline created that week, and any immediate anomalies that need attention.
Format: A shared dashboard or Google Sheet reviewed in a Monday standup. No narrative required.
One exception: if weekly pipeline creation drops more than 30% from the prior week's average, escalate to your CEO with context before they ask. Getting ahead of a trend is always better than explaining it after the fact.
Monthly Lead Generation Report
Audience: CEO, CFO, and sales leadership.
Focus: Full five-section structure — executive summary, pipeline dashboard, channel breakdown, wins and misses, next priorities.
Deliver the report 3–4 business days after month-end. Not in the first week when data is still settling. Not in the third week when it's stale.
Keep it to 2–3 pages for the written report. Supporting dashboards can live in the appendix for anyone who wants to go deeper — but the main document should never require more than 5 minutes to read.
Quarterly Lead Generation Report
Audience: Full leadership team. Sometimes the board.
Focus: Trend analysis across the full quarter — what changed, what compounded, and what signals are pointing toward next quarter.
Add three layers beyond the monthly format:
- Channel attribution evolution (are the mix shifts intentional or reactive?)
- LTV:CAC ratio update
- A forward-looking budget recommendation for the next quarter, grounded in performance data.
This is the report where you defend or request budget. Every number in it should connect to a clear ask or recommendation. If it doesn't, it's taking up space.
Lead Generation Report Template — What to Include
A practical monthly lead generation report template covers six elements:
- Reporting period + summary metrics table
- Pipeline and revenue section
- Channel performance table
- Wins and underperformance observations
- Next period priorities
- Appendix with supporting data
Summary metrics table structure:
Keep this table to 5–7 headline metrics. If everything is tracked at the same level, nothing is prioritized.
Channel performance table structure:
Recommended tools:
- Live dashboards: Google Looker Studio or Tableau — connect directly to your CRM for real-time pipeline data.
- Executive narrative format: Google Slides or Notion — the format CEOs actually open and read.
Attribution model recommendation: Use a multi-touch model (linear or U-shaped) for pipeline reporting. First-touch over-credits brand awareness. Last-touch over-credits sales. Neither gives your CEO an accurate picture of marketing's actual contribution to revenue.
How to Build a Lead Generation Report When You Don't Have All the Data
Most B2B teams are reporting before their attribution infrastructure is fully mature. That's fine. A credible, honest report with acknowledged gaps is more trustworthy than a polished slide deck that inflates performance.
Here's how to progress through the three stages:
Stage 1 — No Attribution Tool
Work with UTM parameters on all links, CRM lead source tracking, and a manual attribution spreadsheet. It's imperfect but defensible. You can report CPL by channel, rough MQL volume, and early-stage pipeline signals. Start here and be transparent about the limitations.
Stage 2 — Basic Attribution
CRM with lifecycle stage tracking plus channel source data. You can now report CPL by channel, MQL volume with conversion rates, and approximate pipeline contribution per source. Good enough for most SMB and mid-market teams.
Stage 3 — Full Attribution
A dedicated marketing attribution platform — Bizible/Marketo Measure, HockeyStack, or Triple Whale for B2B — feeding pipeline data directly into your reporting stack. This is the standard for growth-stage and enterprise teams serious about defending and scaling their lead generation budget.
What to tell your CEO when data is incomplete:
"We're building toward full pipeline attribution. Here's what we can measure today, and here's the infrastructure we're putting in place to close the gap by Q3."
That level of transparency builds trust. Going quiet or papering over the gaps with activity metrics does the opposite.
One important rule: don't present month-one data as a benchmark. Meaningful CPL and conversion benchmarks require at least 90 days of consistent data.
68% of marketers say improving lead quality is a bigger challenge than increasing volume — which means your CEO is paying attention to quality signals even if you're not reporting them yet.
How Cleverly Makes Lead Generation Easy to Report On

One of the real reasons lead generation reporting is hard for most teams is that campaigns are running across fragmented channels with inconsistent tracking. The data story is hard to tell because the data itself is hard to unify.
When you work with a lead generation agency that operates as a true done-for-you partner, the reporting picture gets a lot simpler. The output metric becomes qualified meetings booked — not impressions, not MQL volume, not campaign reach. That's a number you can put in front of your CEO on day one.
At Cleverly, we run ICP-targeted outbound across LinkedIn, cold email, and cold calling — fully managed end-to-end. Our clients get clear reporting on outreach volume, connection rates, reply rates, and qualified meetings booked. Instead of explaining campaign mechanics to your CEO, you show them meetings on the calendar, pipeline in the CRM, and cost per qualified meeting.
That's the reporting gap closed.
We've helped 10,000+ B2B companies generate pipeline this way, including teams at Amazon, Google, Uber, PayPal, Slack, and Spotify.
Our LinkedIn lead generation services start at $397/month, with full tracking and reporting infrastructure included — so you're never starting from zero when it's time to pull the monthly report together. Cold email lead generation runs on a performance model where you only pay for meeting-ready leads we send you.
The bottom line: when your lead generation is managed by a team that lives and breathes outbound, your CEO report writes itself.
Book a free strategy call with Cleverly and see what done-for-you lead generation looks like!
Conclusion
A lead generation report for your CEO isn't a data dump or a metrics showcase. It's a monthly business case that connects your team's activity to the revenue outcomes leadership actually cares about.
Lead with pipeline and ROI. Break down channel efficiency. Explain what's working and what isn't — with data to back both. Close with clear next steps and budget implications.
Run the process weekly internally, monthly for CEO visibility, and quarterly for strategic decisions. Build toward full attribution, but don't wait for perfect infrastructure to start reporting. A clear, honest report with acknowledged gaps is always more credible than silence.
The best lead generation report is the one that makes your CEO ask "how do we do more of this?" — not "what does any of this mean?"
Frequently Asked Questions
Free Resource
How to Scale a Profitable Cold Call System
Get the complete guide — download it instantly now.

Free Ebook
Download the Free Guide
Enter your details to get instant access.
You're all set! 🎉
Your ebook is downloading now.
Click below if the download didn't start automatically.


