Table of Contents
What Are LinkedIn Analytics and Why Do They Matter?
How to access LinkedIn Page analytics
LinkedIn Analytics Terms & Metrics To Understand
Which Metrics Matter Most by Goal
How to Track Conversions — UTM & Google Analytics
How to Track LinkedIn Post Performance — What to Look For
How To Grow Your Network On LinkedIn With Content & Thought Leadership
Frequently Asked Questions
Modified On :
May 26, 2026
Key Takeaways
- LinkedIn analytics give you data on visibility, engagement, and conversions — so you can refine your strategy.
- Post-level insights (impressions, clicks, engagement rate) help measure what’s resonating with your audience.
- Profile, Company Page, Creator, and Ads dashboards each offer unique analytics tailored to their goals.
- UTM parameters + Google Analytics are essential for tracking conversions beyond LinkedIn.
- Focus on the right metrics for your objective: awareness, engagement, or lead generation.
- LinkedIn's average engagement rate has climbed to 5.20% in 2026 — but benchmarks vary significantly by format and industry. Always compare against your own historical performance first.
LinkedIn is one of the best platforms to build your professional brand, grow an audience, and generate real B2B pipeline. But posting without tracking performance is like running a campaign with your eyes closed.
The good news: LinkedIn's analytics have gotten a lot more useful. According to ConnectSafely.ai's analysis of 1.3 billion LinkedIn members, companies that post four times per week see a 2x lift in engagement — but only if they're paying attention to what's actually working.
That's exactly what this guide is for. We'll walk you through how to access your LinkedIn analytics, which metrics actually matter, how to interpret your post performance over time, and the tools that make tracking easier at scale.
What Are LinkedIn Analytics and Why Do They Matter?
LinkedIn analytics are the built-in reporting tools that show how your content, profile, or Company Page is performing on the platform. They include metrics like impressions, clicks, engagement rate, follower growth, and conversions.
Depending on whether you’re looking at a personal profile, Company Page, or ads account, the analytics dashboard highlights slightly different data — but the goal is the same: helping you understand what’s working and what’s not.
Why LinkedIn Analytics Matter
Tracking analytics isn’t just about collecting numbers — it’s about making smarter decisions. Here’s why they matter:
- Measure visibility – Analytics reveal how many people are seeing your posts impressions and reach so you know if your brand awareness efforts are paying off.
- Understand your audience – Demographics data shows the job titles, industries, and locations of people engaging with your content, helping you tailor future posts.
- Prove ROI – By tracking clicks, CTR, and conversions (with UTMs + Google Analytics), you can directly connect LinkedIn activity to leads and revenue.
- Refine content strategy – High engagement rates and strong post performance highlight which topics and formats resonate most, so you can double down on what works.
- Benchmark growth – Over time, you’ll see whether your follower count, engagement rate, and lead generation are improving — or where you need to adjust.
In short: LinkedIn analytics turn guesswork into data-driven strategy. Instead of posting blindly, you’ll know which efforts drive brand awareness, which spark conversations, and which bring in qualified leads.
How to Access LinkedIn Analytics
Let's uncover how you can access your LinkedIn profile, page, creator/newsletter and Ads analytics.
LinkedIn Posts Analytics
Step 1: Navigate to the post you want to view the analytics for on LinkedIn
First, you need to navigate to the post for which you want to view the analytics. You can do this by going to your LinkedIn homepage, scrolling through your feed until you find the post, or searching for the post using keywords.
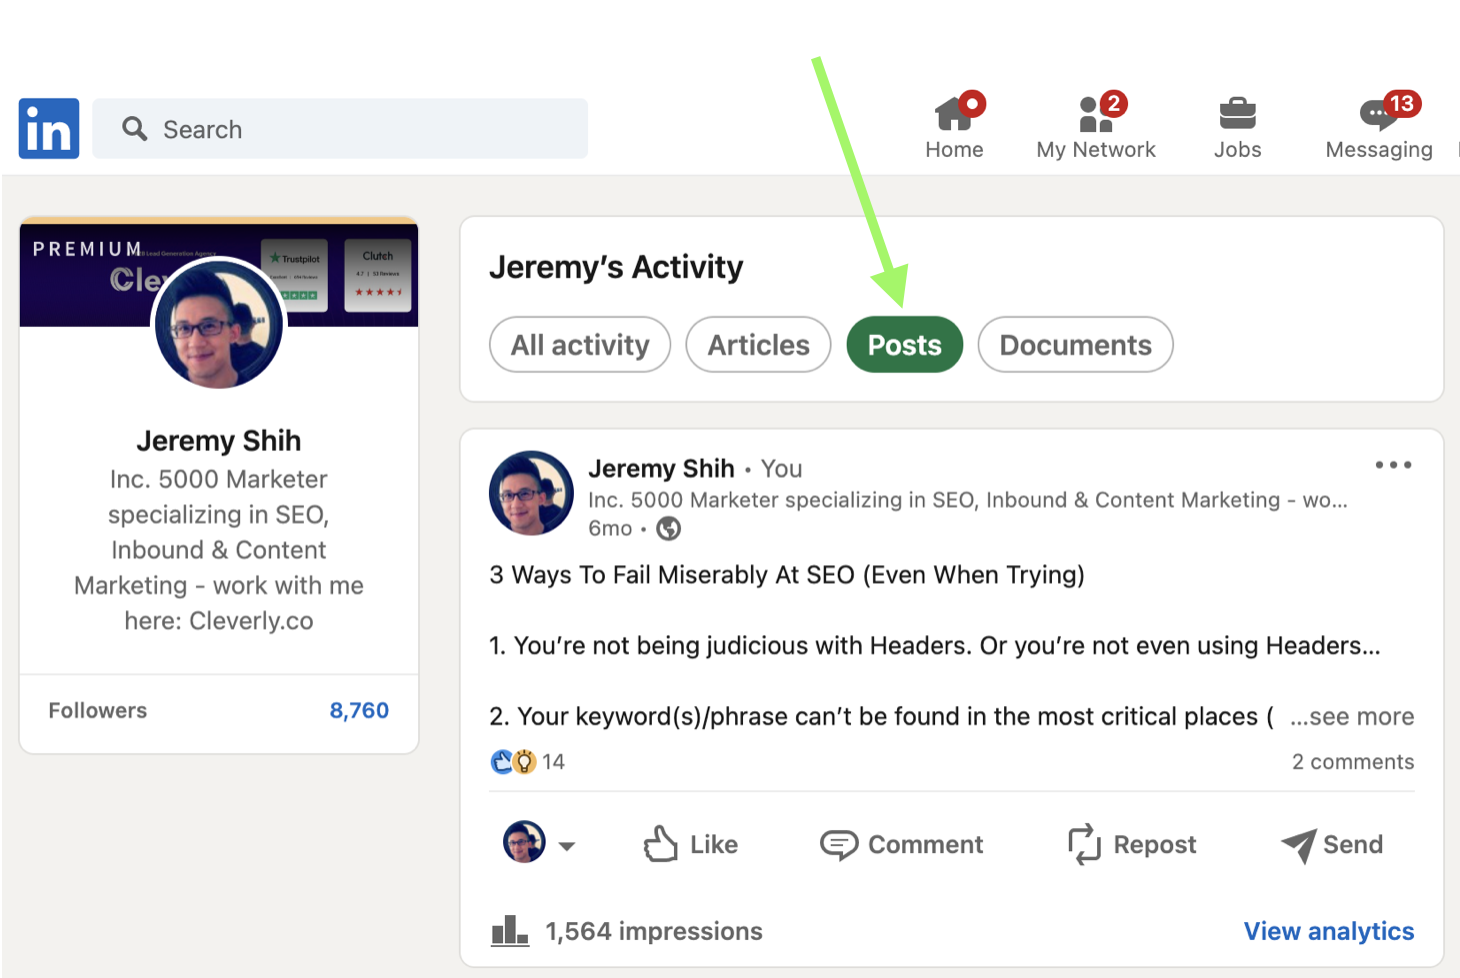
Step 2: Scroll down to the bottom of the desired post where it says "View analytics".
Once you have located the post, scroll to the bottom of the post where it lists impressions on the bottom left and "View analytics" in blue on the bottom right.
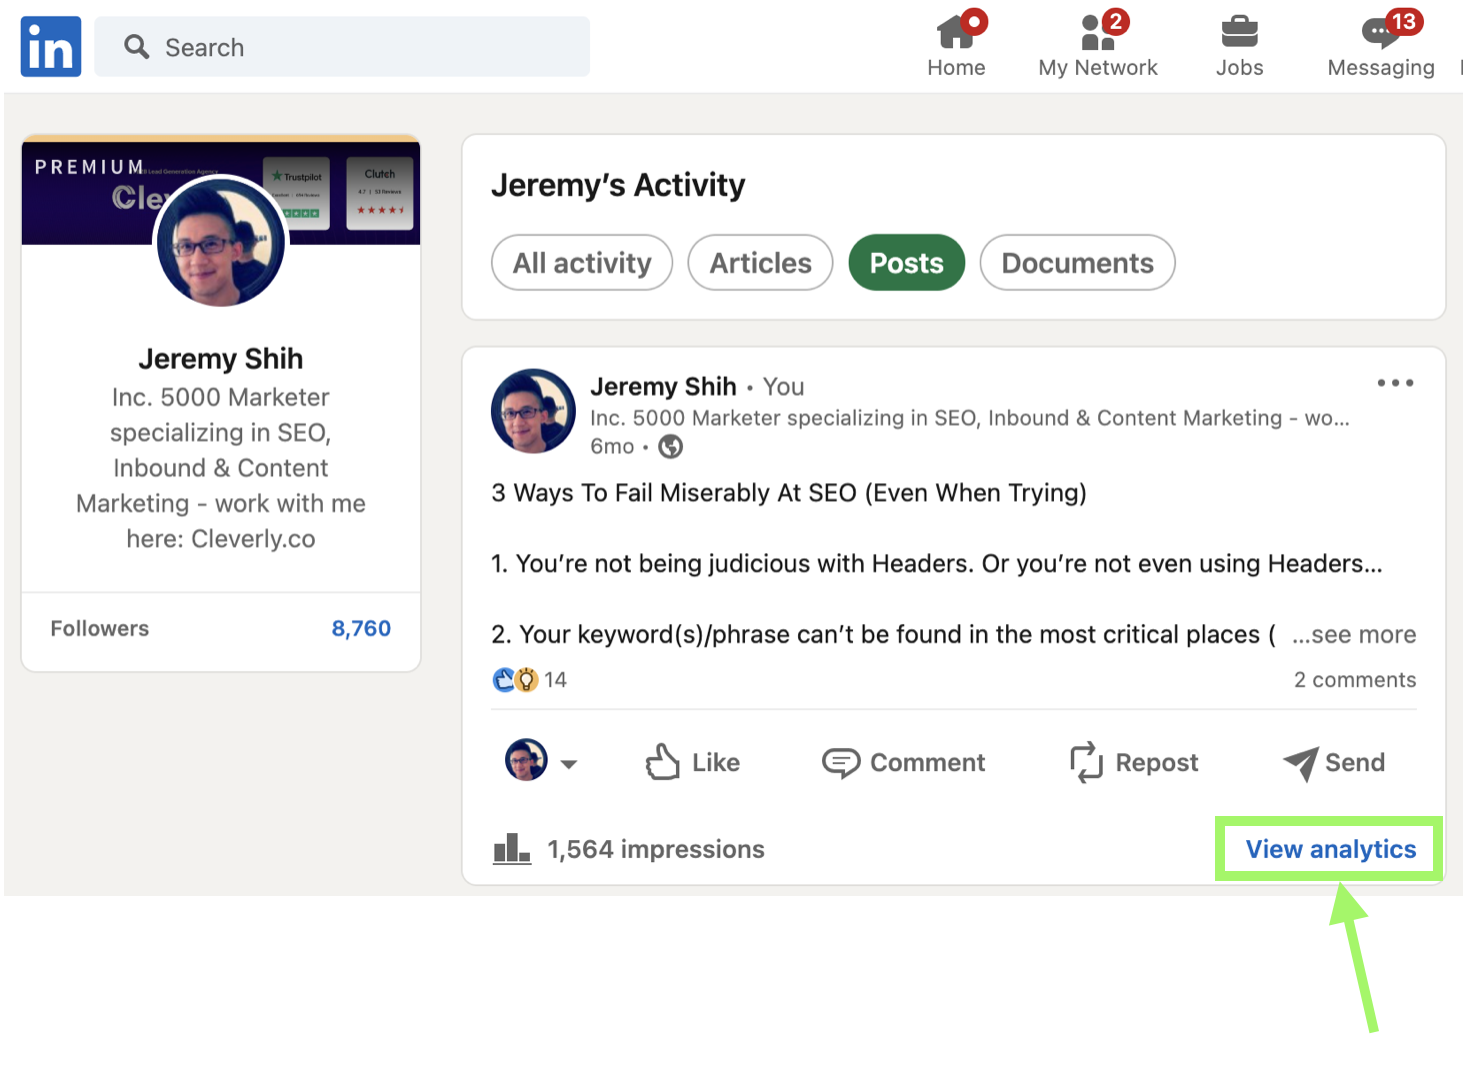
Step 3: Click "View analytics" at the bottom right hand corner of your post.
At the bottom right hand corner of your post, click "View analytics." This will take you to a page that shows you the post analytics.
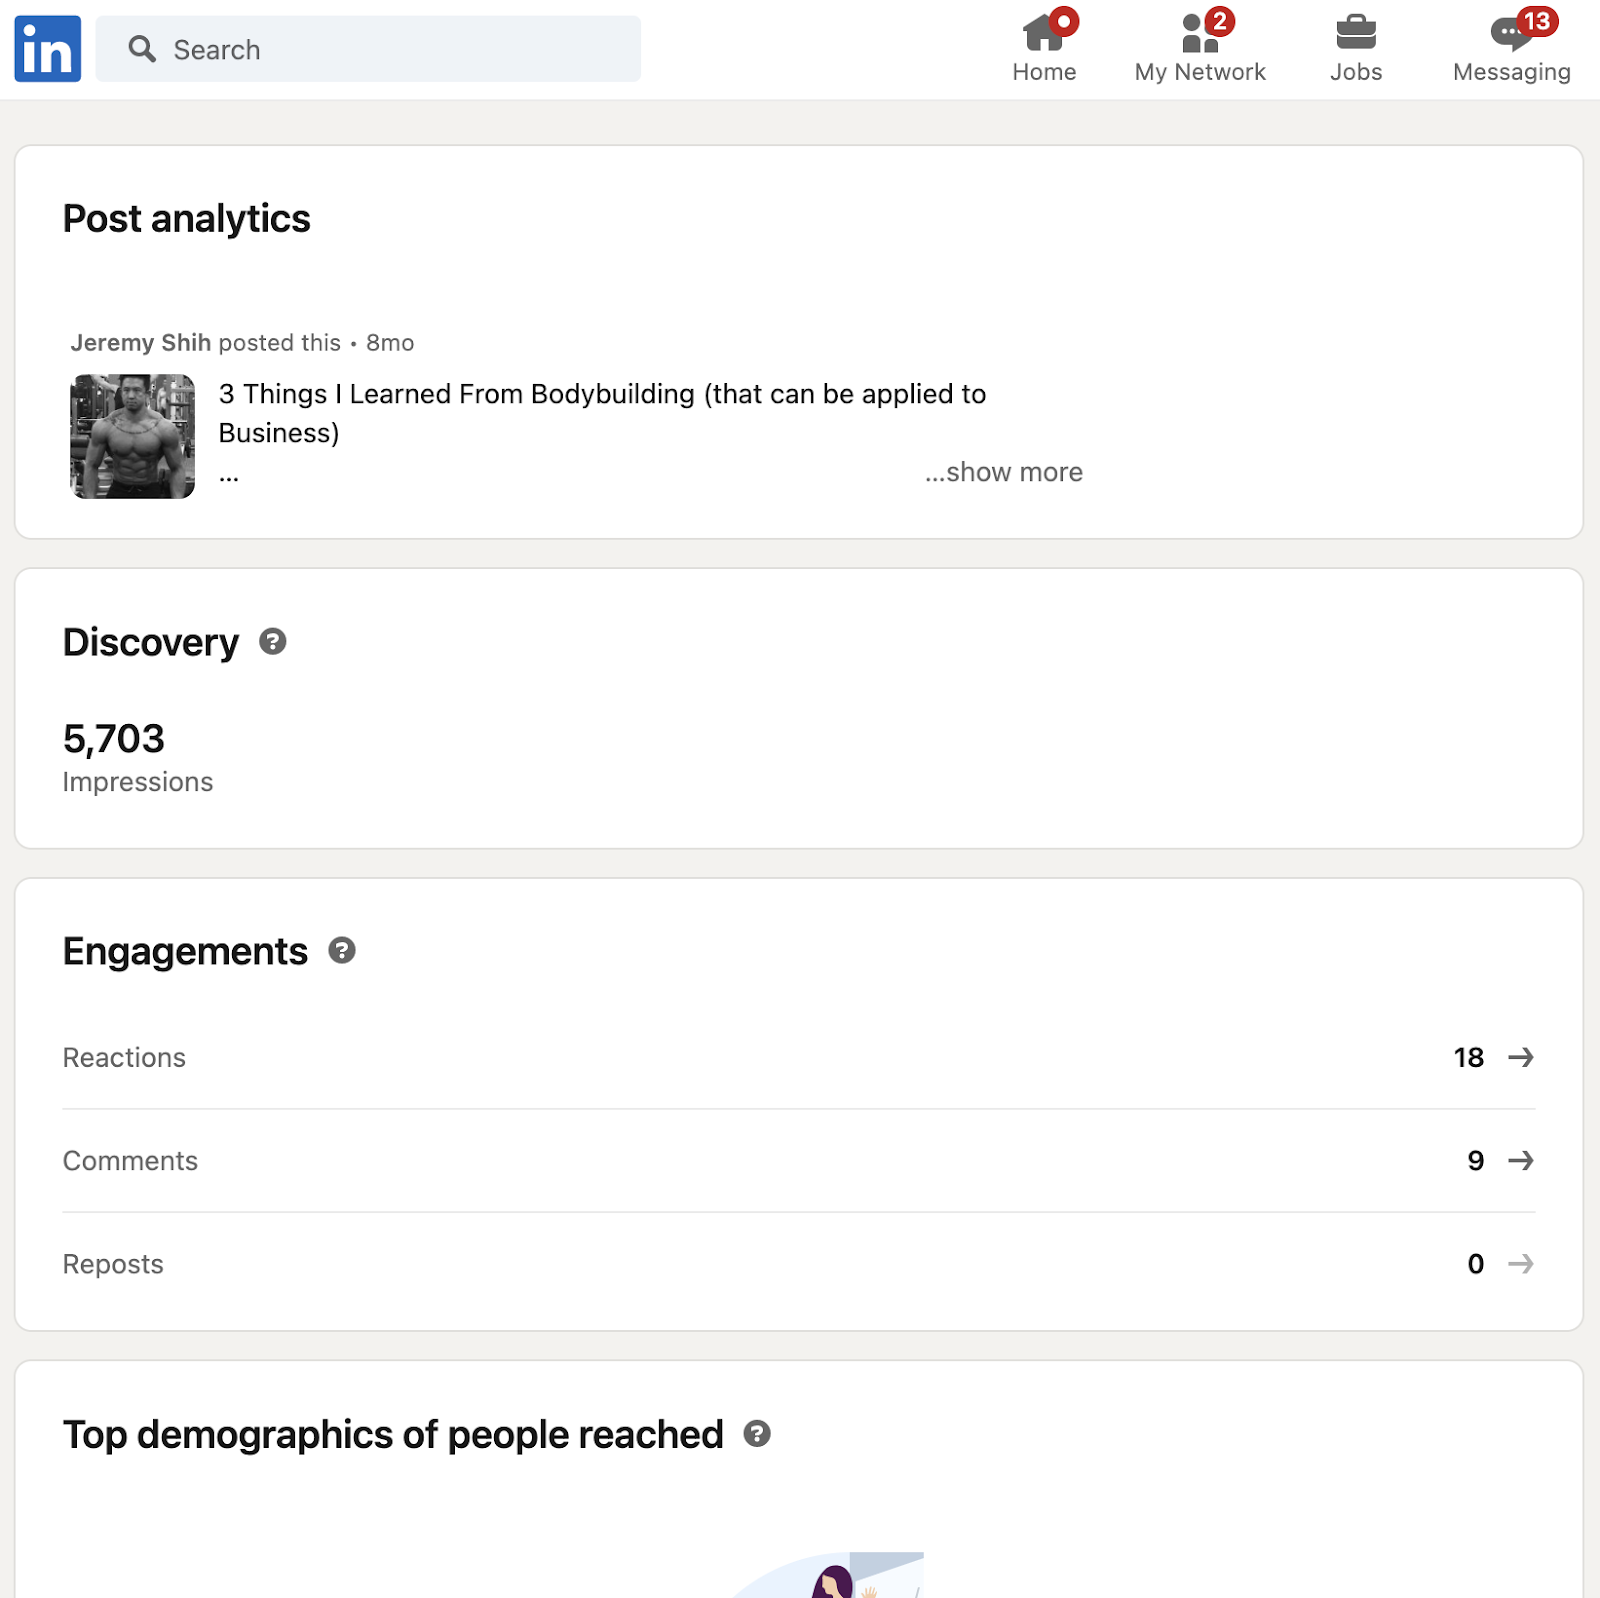
Step 4: Review the analytics data
On the analytics page, you will see a variety of data related to your post's performance. The data includes the number of views, likes, comments, and shares your post has received.
You can also see the number of clicks, the engagement rate, and the demographics of your audience.
When viewing post analytics for your content on LinkedIn, you will come across several terms that may be unfamiliar.
Understanding these terms can help you better analyze and optimize your content strategy.
For a detailed explanation of each of the terms mentioned in the LinkedIn post analytics, scroll down to the section “LinkedIn Analytics Terms & Metrics To Understand”.
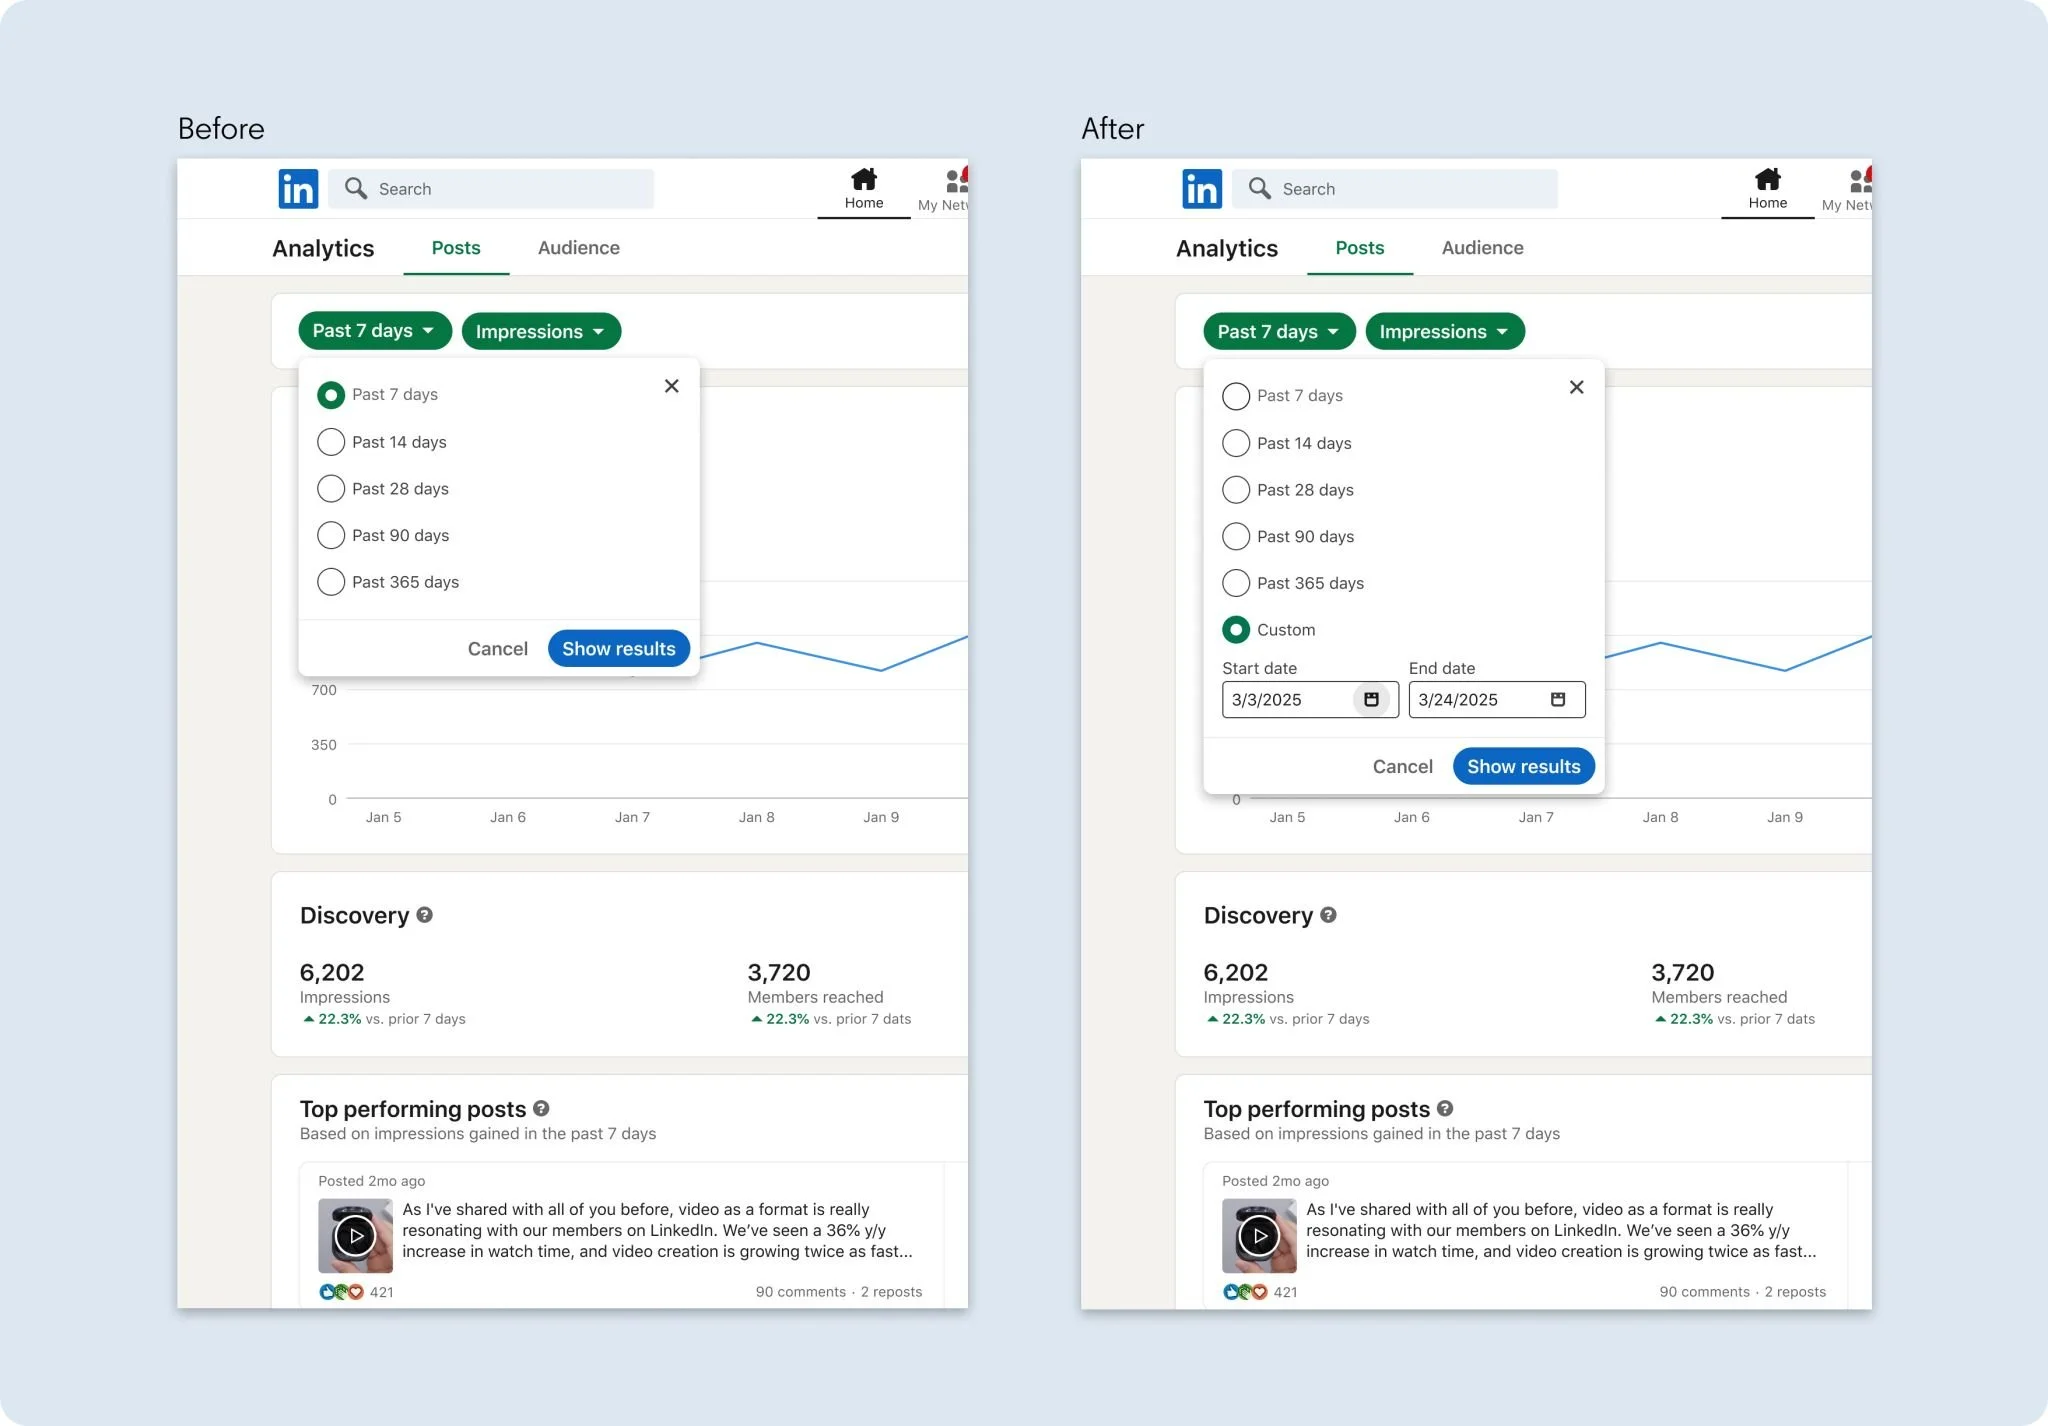
Step 5: Use the filters to view analytics data for different time periods or audience segments
If you want to view analytics data for a specific time period or audience segment, you can use the filters at the top of the analytics page.
You can filter the data by date range, audience demographics, and post type.
Note: this functionality may not be available for posts after a certain time period.
Step 6: Download the analytics data in a CSV file
If you want to analyze the data further, you can download it in a CSV file. To do this, click the "Export all data" button at the top of the analytics page.
This will download a CSV file that contains all of the data related to your post's performance.
Detailed notes on your LinkedIn Analytics (e.g. how long demographic data is available for) are available here.
Profile Analytics (Personal Profile)
If you want analytics for your personal profile (not just individual posts):
- Log in to LinkedIn.
- Click on the Me icon in the top navigation bar.
- From the dropdown, select View profile.
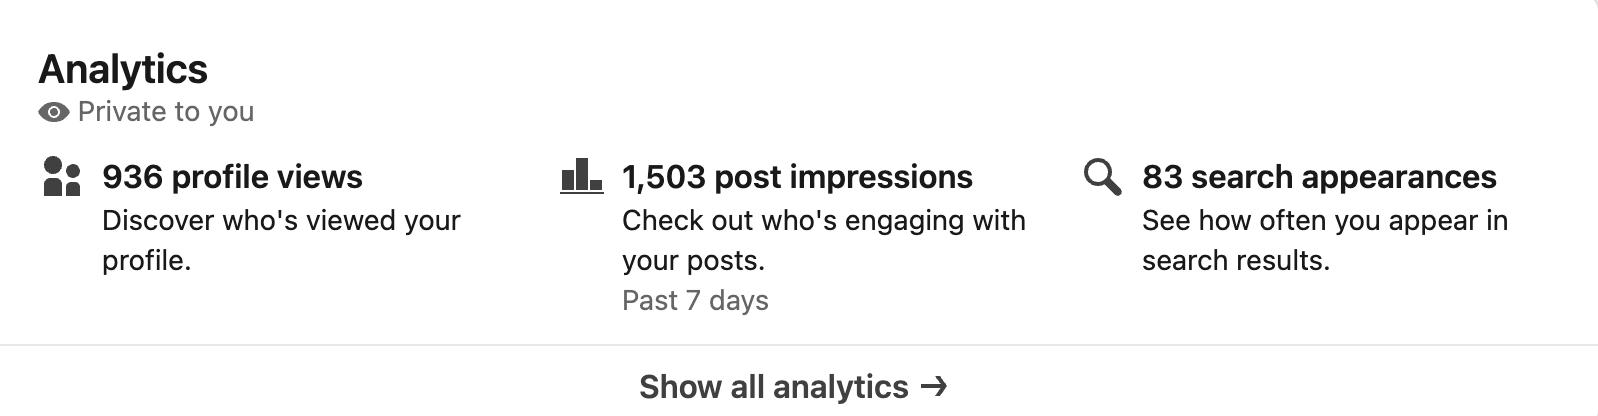
- On your profile page, scroll down until you see the Analytics / Dashboard section. There you'll usually find different tabs like Profile views, Post Impressions, Search appearances and more.
- You can adjust the date range for this data, filter by content types, etc. Some parts are only available if you have a LinkedIn Premium account.
Company Page Analytics
If you manage a LinkedIn Company Page, you get richer data across many dimensions:
- Log in to LinkedIn and ensure you have admin / analyst access to the Company Page.
- Click Me → Manage (or from your profile dropdown choose your Company Page).
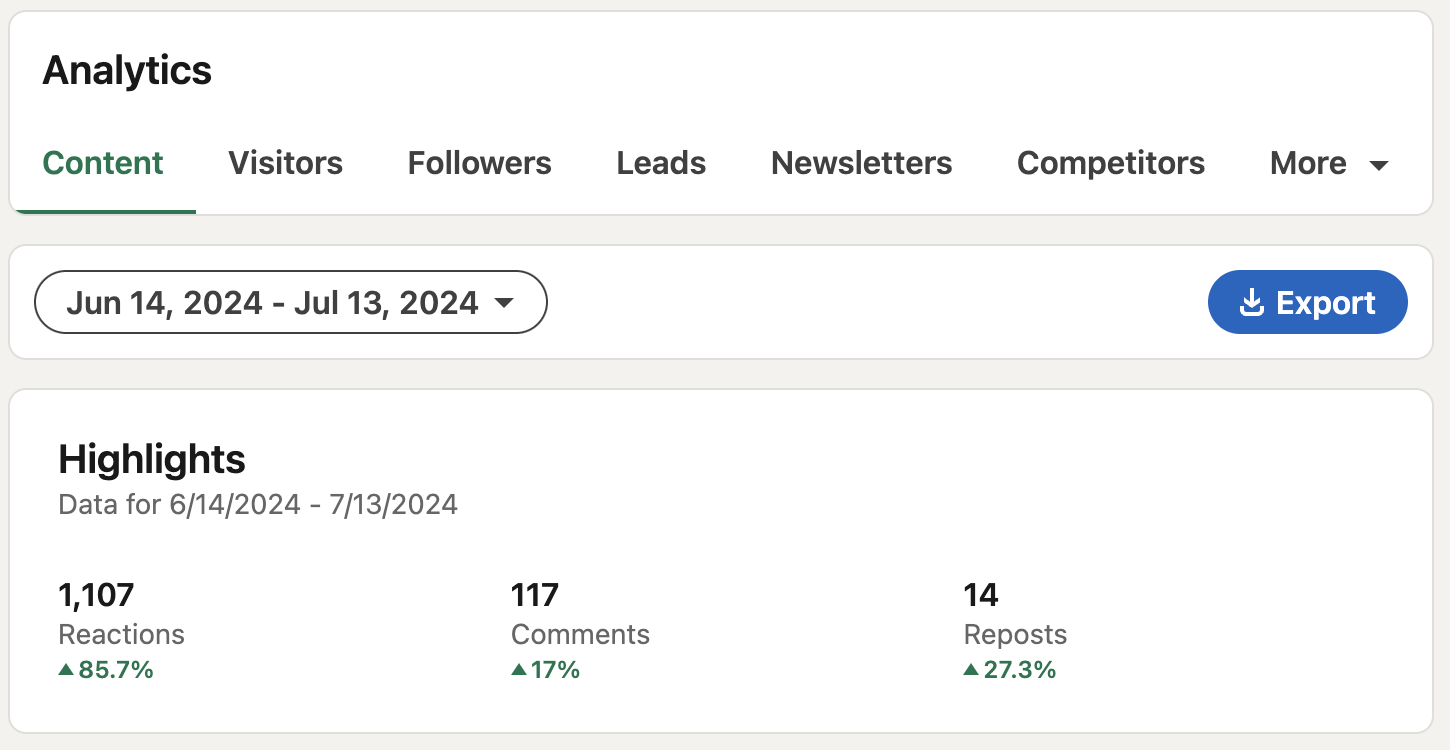
- On the left navigation panel of the Company Page, choose Analytics. Under Analytics you’ll see sub-tabs such as Updates / Content, Visitors, Followers, Search Appearances, Newsletter, etc.
- Depending on the tab, you can get metrics like impressions, engagement (likes/comments/shares), click-throughs, follower demographics (industry, seniority, location), visitor views, trends over time, etc.
Creator / Newsletter Analytics
If you write Newsletters on LinkedIn or are registered as a creator:
- Newsletter metrics live under the Company Page’s Analytics (if it's a page that publishes, or under your Creator profile). You’ll see stats like number of subscribers, new subscribers over time, article impressions, reads, engagements on the newsletter content.
- For Creator profiles, there may also be additional breakdowns for which articles / posts are driving more subscriber growth, which topics perform better, etc. (depending on features enabled for your account).
Campaign Manager (Ads / Paid Analytics)
If you run paid campaigns on LinkedIn ads, here’s how to access detailed campaign-level metrics:
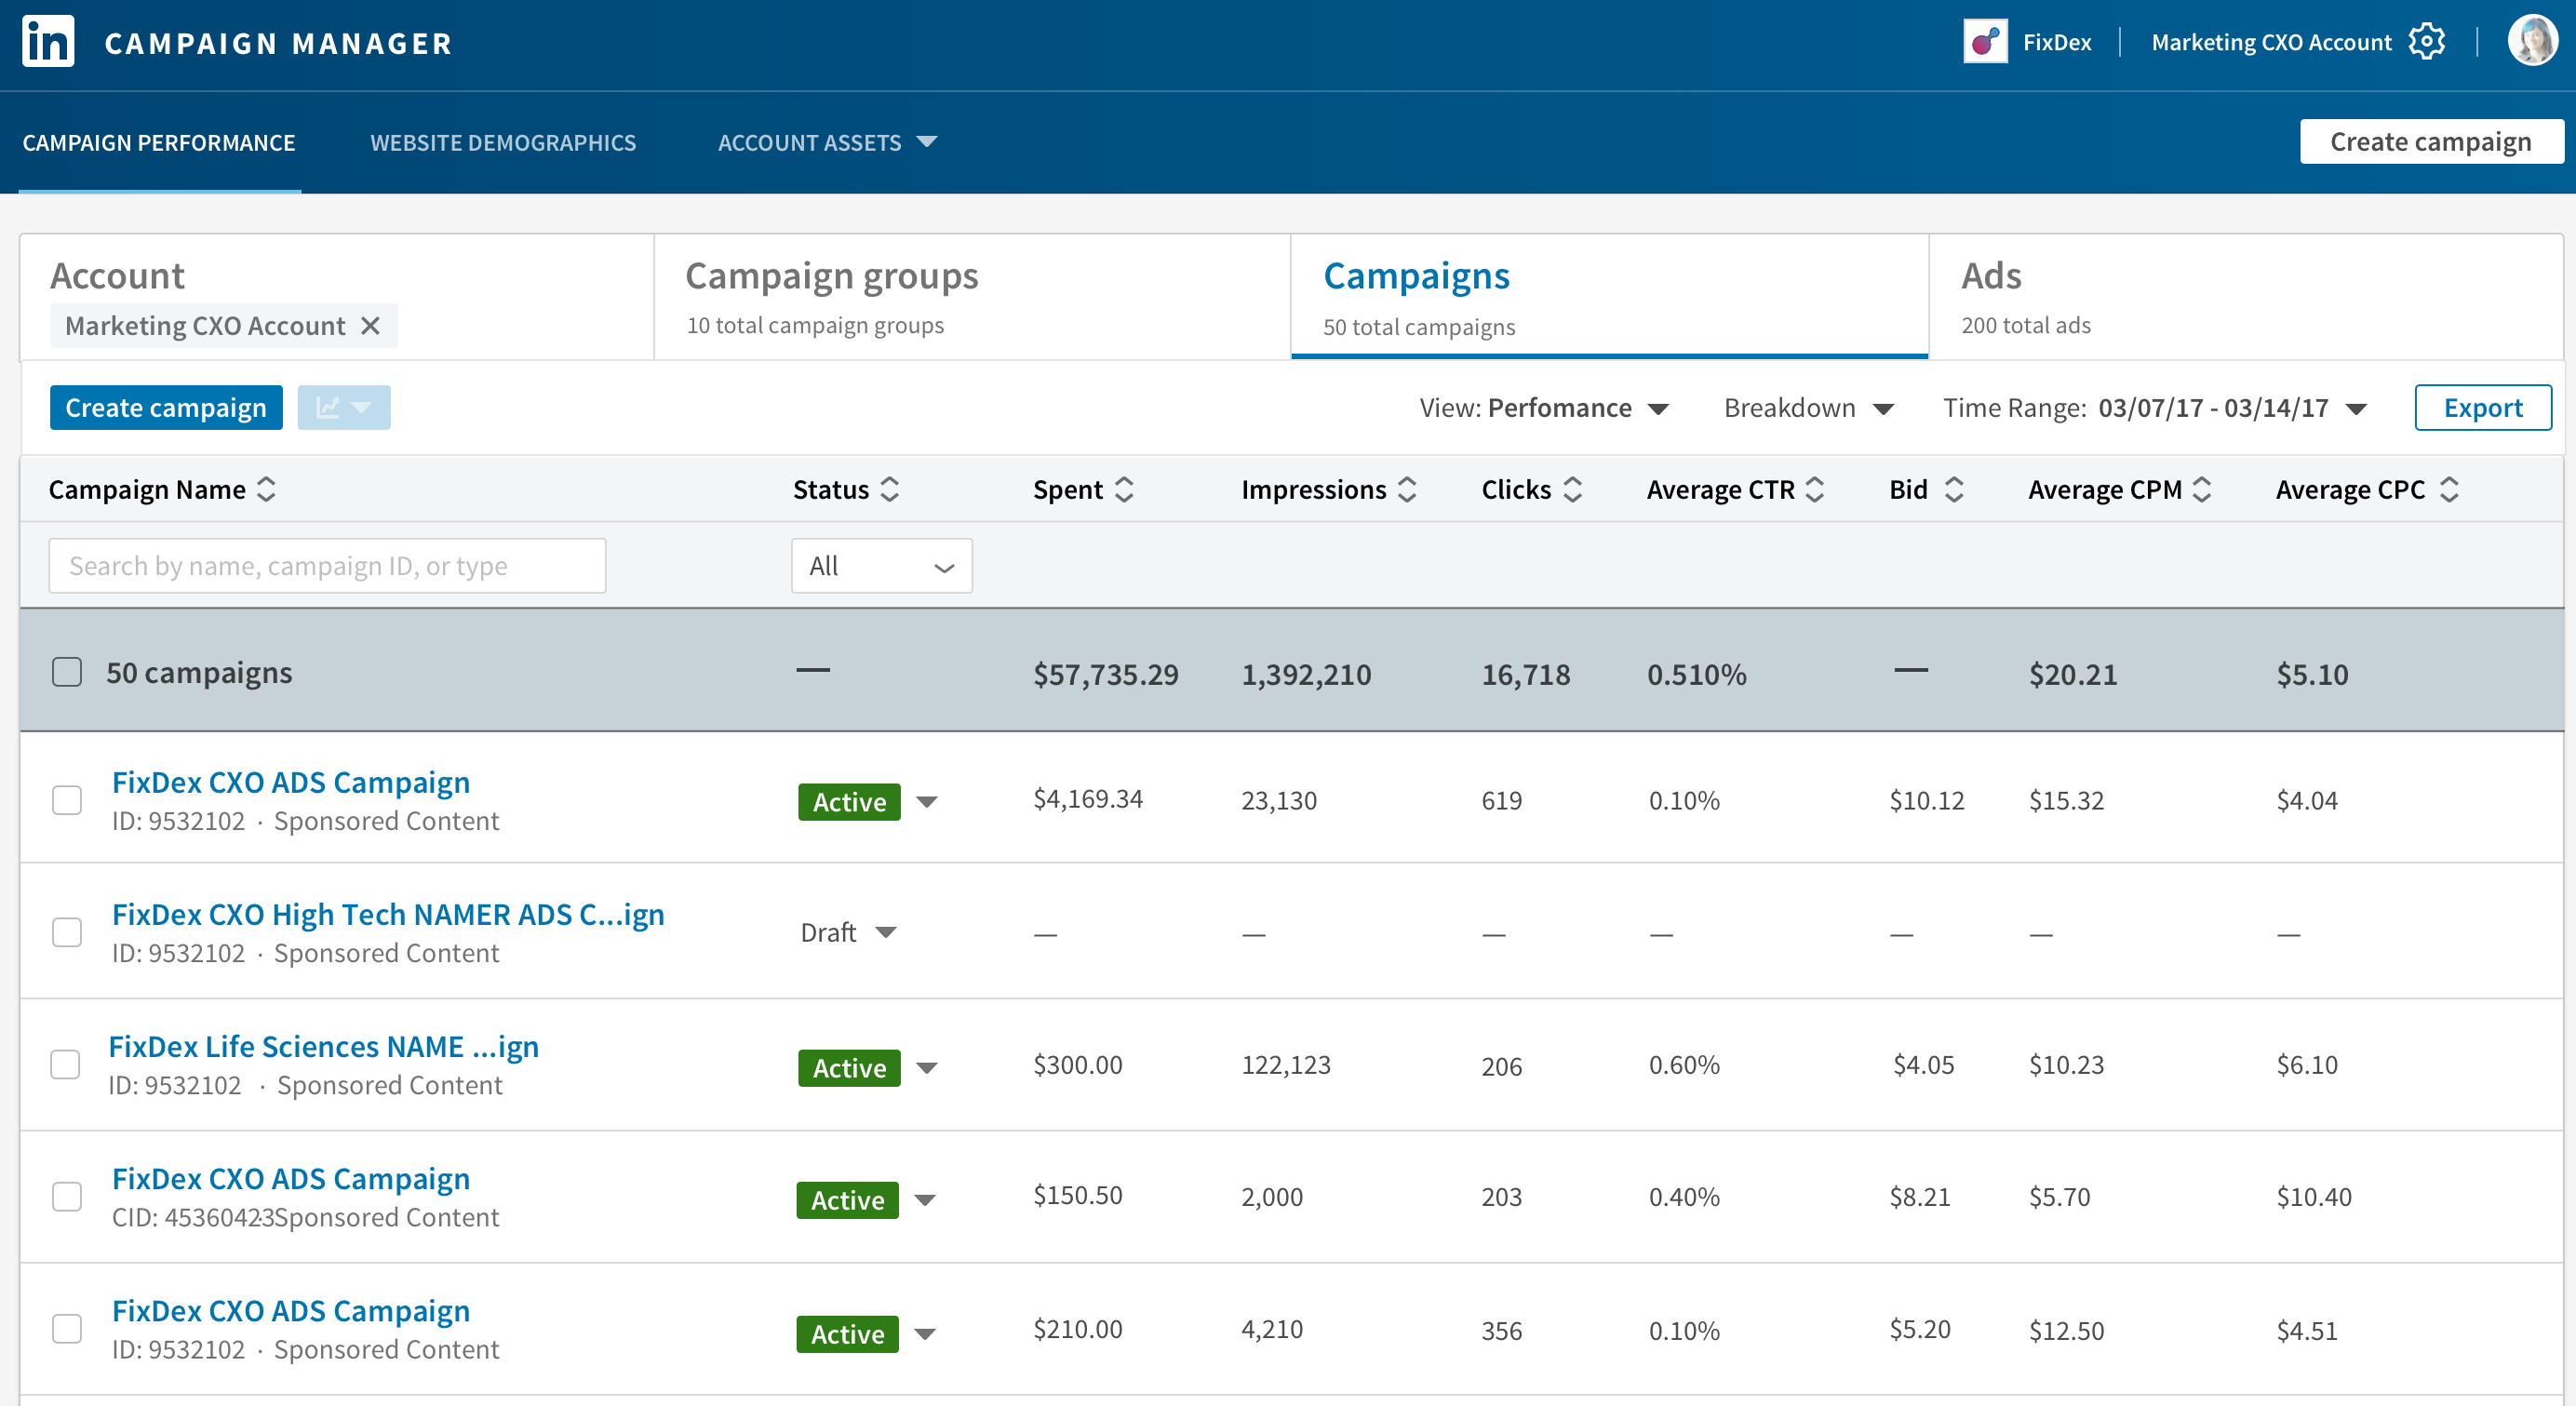
- Log into LinkedIn and go to Campaign Manager (linked to your ads account).
- Inside Campaign Manager, you’ll see your Ad Accounts → Campaign Groups → Campaigns → Individual ads.
- From there you can view metrics such as:
- Impressions (how many times ad was shown)
- Clicks / Click-through rate (CTR)
- Cost metrics like CPC (cost per click), CPM, etc.
- Conversion metrics (if you have conversion tracking set up), like leads, sign-ups, purchases, etc.
- You can also export reports (CSV or Excel) from Campaign Manager to do deeper analysis.
📊 Analytics Show Reach, We Deliver Leads
Views and impressions are nice, but our LinkedIn lead gen service turns data into booked sales meetings.
Start generating leads for just $397/month.
LinkedIn Analytics Terms & Metrics To Understand
Understanding these metrics, and how they’re calculated, is key to measuring what’s really working on LinkedIn.
Views
How many times your content was actually watched or read. For videos, LinkedIn typically counts a view when someone watches for at least 3 seconds. Views and impressions aren’t the same.
Impressions
The number of times your content appeared on a LinkedIn member’s screen — regardless of whether they engaged with it. One person can generate multiple impressions if they see your post more than once.
Clicks
The total number of clicks on your post, including links, images, hashtags, and your company name/logo.
Engagement Rate
The percentage of people who interacted with your content.
Formula: Engagement Rate= (Clicks + Likes + Comments + Shares + Follows) ÷ Impressions.
CTR (Click-Through Rate)
The percentage of impressions that resulted in a click.
Formula: CTR=Clicks ÷ Impressions
Likes / Reactions
The number of positive interactions (likes, celebrates, loves, etc.).
Comments
Total comments left on your post.
Shares
How many times your post was shared with someone’s network.
Follows
The number of people who followed your Page directly from your content.
Demographics
Insights into the type of audience engaging with your content (job title, company size, seniority, industry, and location).
Time Period
The date range you select when analyzing results.
Audience Segment
Which audience you’re analyzing (all LinkedIn members, your Page followers, or a specific audience segment).
Post Type
The kind of content you shared (article, image, video, document, poll, etc.).
Which Metrics Matter Most by Goal
Not every LinkedIn campaign has the same purpose. The metrics you prioritize will depend on whether you’re trying to get seen, spark conversations, or generate leads.
Here’s how to focus:
1. Brand Awareness
If your main goal is to increase visibility and get your name in front of more people, track:
- Impressions – How many times your content appeared on users’ feeds. A rising impression count signals your content is reaching more eyeballs.
- Reach – The number of unique people who saw your post. This shows audience size without duplicate counts.
- Follower Growth – Are more people choosing to follow your Company Page or personal profile after seeing your content? Consistent follower growth = growing awareness.
💡 Example: If you launched a new product and your post gets 50,000 impressions but only a few clicks, that’s still a win for brand visibility — your message reached a large audience.
2. Engagement
Awareness is only half the story — you also want people to interact with your content. Track:
- Engagement Rate – The percentage of impressions that turned into actions (clicks, likes, comments, shares, or follows).
- Comments – Valuable because they start conversations and boost visibility in the feed.
- Shares – Every share expands your reach beyond your immediate network and signals strong interest in your content.
💡 Example: A thought-leadership post with a 4% engagement rate (well above average) shows that your content is resonating deeply, even if impressions aren’t sky-high.
3. Lead Generation
For B2B and sales teams, LinkedIn is one of the best lead-gen platforms. Here, you’ll want to focus on actions that move prospects into your B2B funnel:
- Clicks – Are people curious enough to click through to your site or offer?
- CTR (Click-Through Rate) – A higher CTR indicates your messaging is compelling and relevant.
- Form Completions – Track how many people filled out your lead-gen form or downloaded your asset.
- Conversions – The ultimate metric: did they become a lead, sign up, or purchase? Use UTM parameters + Google Analytics to accurately track conversions from LinkedIn traffic.
💡 Example: A campaign with modest impressions but a 1.5% CTR and multiple demo sign-ups is more valuable for sales than a viral post with no conversions.
Benchmarks to Keep in Mind
- On LinkedIn, engagement rates of ~2% or higher are considered strong.
- But benchmarks vary by industry, company size, and content type. A small niche audience might have lower impression counts but higher engagement rates.
- The most reliable benchmark is always your own historical performance — track whether your metrics are improving month-over-month.
The key is alignment: Measure success against your goal for the campaign. A brand-awareness campaign shouldn’t be judged on conversions, just as a lead-gen ad shouldn’t be judged on likes.
🚀 Go Beyond Metrics, Get Clients
Tracking analytics is step one—Cleverly’s proven outreach ensures your LinkedIn activity drives real ROI. Book a free LinkedIn strategy call today.
How to Track Conversions — UTM & Google Analytics
Getting impressions and clicks is great, but the real question is: Are those LinkedIn clicks turning into leads or customers? To answer that, you need proper conversion tracking.
The two most common tools are UTM parameters and Google Analytics (GA). Here’s how to set it up:
1. Add UTM Parameters to Your LinkedIn Links
UTM parameters are short tags you add to your URLs so Google Analytics can tell exactly where your traffic is coming from.
Step-by-step:
- Start with your base URL (e.g.,
https://www.yoursite.com/demo).
- Add UTM tags to identify LinkedIn as the traffic source:
https://www.yoursite.com/demo?utm_source=linkedin&utm_medium=social&utm_campaign=demo_launch
utm_source=linkedin→ tells GA the traffic came from LinkedIn.utm_medium=social→ specifies that it’s organic or paid social traffic.utm_campaign=demo_launch→ lets you track which post, ad, or campaign drove results.
- Use a free tool like Google’s Campaign URL Builder to generate UTMs quickly.
- Paste the tagged URL into your LinkedIn posts or Ad creatives.
💡 Pro Tip: Keep UTM naming consistent. For example, always use linkedin (not LinkedIn or li) so reporting stays clean.
2. Create a GA Segment to See LinkedIn Traffic
Once UTMs are set, you can see exactly how much LinkedIn traffic converts inside Google Analytics.
Step-by-step (GA4):
- Go to Google Analytics → Reports → Acquisition → Traffic acquisition.
- Click Add Filter.
- Choose Session source = linkedin (this matches your UTM tag).
- Apply the filter, and you’ll see all traffic that came from LinkedIn — plus metrics like conversions, revenue, or sign-ups.
- Save this as a custom Segment so you can easily track LinkedIn performance over time.
💡 Pro Tip: If you’re running both organic posts and paid ads, create two separate UTMs (utm_medium=social vs. utm_medium=paid_social) so you can segment them in GA.
3. Attribute Leads Back to LinkedIn Posts vs Ads
Sometimes you’ll want to dig deeper — not just “LinkedIn traffic” but which LinkedIn activity drove the lead.
- For Ads:
- Go into LinkedIn Campaign Manager.
- Open the campaign → click Performance.
- Export your Lead Gen Form data or site conversions if you’ve set up conversion tracking.
- You’ll see which campaigns, ad groups, and creatives produced leads.
- For Organic Posts:
- If you’ve used unique UTMs for each post (e.g.,
utm_campaign=webinar_julyvsutm_campaign=ebook_august), GA will show you which content brought in the most conversions. - Combine GA data with LinkedIn’s native Post Analytics to see both engagement (clicks/comments) and resulting leads.
- If you’ve used unique UTMs for each post (e.g.,
💡 Pro Tip: Always match your UTM campaigns to the names of your posts or ad campaigns in LinkedIn. This makes it much easier to tie back results when reporting.
How to Track LinkedIn Post Performance — What to Look For
Knowing where to find your analytics is only half the job. The other half is knowing what you're actually looking at — and what to do when the numbers don't look right.
Here's how to read your post performance the right way.
Don't Check Too Early
One of the most common mistakes people make is pulling analytics within the first few hours of posting. LinkedIn's algorithm takes time to distribute content. Wait at least 48 to 72 hours before drawing any real conclusions from a post's numbers. First-day data is almost always incomplete.
That said, the first 60 minutes do matter for one specific reason: early engagement velocity. Comments and reactions in the first hour signal to LinkedIn's algorithm that your content is worth pushing further. If a post picks up momentum quickly, it tends to reach a wider audience in the hours that follow. You can't control this after the fact, but it's worth noting which posts tend to ignite quickly versus slowly.
Key Signals to Monitor
Once a post has had 48 to 72 hours to settle, here's what to look at:
1. Impressions trend. Are your posts reaching more or fewer people week over week? A gradual climb signals that LinkedIn is warming up to your content. A steady decline — with no change in posting frequency — is almost always a hook quality issue.
2. Engagement rate. This is the single most important post-level metric. It's calculated as total interactions (reactions, comments, clicks, shares) divided by impressions. It tells you whether the people who saw your post actually cared about it. According to Socialinsider's 2026 LinkedIn Benchmarks report, based on 1.3 million posts across 16,645 business pages, LinkedIn's average engagement rate has reached 5.20% — so if you're consistently sitting below 2%, your content isn't resonating.
3. Comments. LinkedIn's algorithm weights comments significantly heavier than likes. A post with 10 comments and 20 reactions will typically outperform one with 5 comments and 200 reactions. Comments are the metric most worth actively pursuing.
4. Saves and bookmarks. When someone saves your post, it signals to LinkedIn that your content has long-term value — not just scroll-stopping appeal. Saves tend to trigger additional distribution boosts over time, even days after your original post.
5. Profile views spike. After publishing, check whether your profile views increase. Specific posts drive people to look you up. Tracking which content topics send people to your profile helps you understand what's building genuine interest versus just generating passive scrolls.
Red Flags to Watch
A few patterns are worth paying attention to:
- High impressions, low engagement rate. LinkedIn is pushing your content out, but it's not landing. The audience may be wrong, or the content itself isn't connecting. Time to revisit your hook or topic relevance.
- High engagement rate, flat follower growth. Your existing audience loves what you post, but new people aren't discovering you. This usually means your content is resonating inside your network but not spreading beyond it. Think about what would make someone want to share your post with their audience.
- Impressions dropping with no change in posting frequency. This is almost always a hook quality issue. LinkedIn's algorithm distributes your content to a small sample first. If that sample doesn't engage, distribution stops. Tighter, more specific hooks tend to fix this.
2026 Benchmarks to Compare Against
The average LinkedIn engagement rate in 2026 sits at 3.85% for personal profiles and 2.1% for company pages. Carousel and document posts consistently outperform all other formats, averaging 6.6 to 7%.
Data from SociaVault Labs' analysis of 40,000+ LinkedIn profiles shows the top 10% of performers post three to four times per week. Daily posting tends to dilute engagement per post.
Use these as a general reference point, but remember: your best benchmark is always your own previous performance. Are your numbers improving month over month? That's the question that matters most.
A Simple Tracking Routine
You don't need to obsess over analytics daily. A structured routine is more useful than constant checking.
Weekly: Check impressions per post, engagement rate trend, your top three posts by engagement rate, and follower growth.
Monthly: Compare your average engagement rate to the prior month. Break down performance by format — which content types (text, carousels, video) consistently outperform? Cross-reference profile views with specific posts to see what's driving real interest.
Keeping a simple spreadsheet with these numbers takes about 15 minutes per week and gives you a clear picture of what's working over time.
Automated LinkedIn Post Performance Tracking
If you're posting regularly and managing multiple campaigns, manually pulling post-level data from LinkedIn's native dashboard gets old fast. LinkedIn's built-in analytics are useful for spot-checks, but they have real limitations at scale.
There's no auto-calculated engagement rate per post. Data is spread across multiple sections. You can't easily compare performance across content formats. And historical data access is limited, which makes month-over-month trend analysis harder than it should be.
That's where third-party tracking tools come in. Here's what's worth knowing about each option.
LinkedIn Native Analytics (Free)
LinkedIn's built-in analytics work well for checking individual posts and getting a quick demographic snapshot of who's engaging with your content. If you're just starting out or posting infrequently, this is enough.
The limitations show up once you're posting consistently. There's no side-by-side format comparison, no engagement rate automatically calculated at the post level, no competitive benchmarking, and no easy way to look back further than the standard date ranges allow.
Best for: individual post spot-checks and quick audience demographic reviews. Not ideal for tracking trends across 20 or 30 posts at a time.
AuthoredUp
AuthoredUp has become the go-to tool for B2B creators and marketers who want deeper post-level analytics than LinkedIn provides natively. It auto-calculates engagement rate per post, tracks saves alongside standard engagement metrics, and lets you compare performance across content formats side by side.
One particularly useful feature: you can import your LinkedIn GDPR data archive, which gives you access to multi-year historical post data — something LinkedIn's native dashboard doesn't offer. This makes it possible to spot long-term trends and seasonal patterns that simply aren't visible otherwise.
Worth noting: Shield Analytics, which many LinkedIn creators relied on for years, is winding down in 2026. AuthoredUp is the most commonly recommended migration path.
Pricing: a 14-day free trial is available.
Sprout Social
If your team is managing LinkedIn alongside other social channels and needs unified reporting, Sprout Social is worth considering. It pulls together LinkedIn Page performance, paid campaign data, audience demographics, and competitor benchmarking into a single dashboard — which saves a significant amount of manual reporting time.
It also supports UTM-based ROI tracking, so you can tie LinkedIn post performance back to actual website conversions without having to flip between multiple tools.
Best for: marketing teams running multi-channel programs who need one place to see performance and prove ROI. A 30-day free trial is available.
Brand24
Brand24 takes a different approach than the other tools here. Instead of focusing on post-level analytics, it tracks brand mentions, hashtag performance, and sentiment across LinkedIn and other platforms. If you're running campaigns around a specific topic, product launch, or event, it's useful to know how your brand is showing up in conversations beyond just your own posts.
Key features include AI-driven mention monitoring, reach and engagement tracking by campaign or hashtag, and cross-platform brand perception data.
Best for: teams that want to track how a campaign or announcement is landing across LinkedIn — not just in their own analytics, but in the broader conversation.
How To Grow Your Network On LinkedIn With Content & Thought Leadership
In conclusion, tracking your post analytics on LinkedIn is essential to understanding your audience's engagement with your content.
By following these six steps, you can gain valuable insights into how your posts are performing and use that information to optimize your content strategy.
Are you looking to position yourself as a thought leader in your industry?
At Cleverly, we’ve helped hundreds of clients build authority, effectively market their products and services, and powerfully scale their businesses to new levels with our LinkedIn content marketing.
Learn more about our LinkedIn content services here or book a call with one of our strategists for a free consultation.
Frequently Asked Questions
Free Resource
How to Scale a Profitable Cold Call System
Get the complete guide — download it instantly now.
Free Ebook
Download the Free Guide
Enter your details to get instant access.
You're all set! 🎉
Your ebook is downloading now.
Click below if the download didn't start automatically.